Building Raspberry Pi HAB radio tracker software (part 3): LoRa range and battery life tests
This is the third part of a series of blog posts that follow and document my first attempt to launch a high-altitude balloon (HAB) to perform aerial photography. The posts are focused on developing Linux-based software on Raspberry Pi for tracking high-altitude balloons. This post presents the results of LoRa radio transmission tests to determine the maximum range of the transmissions of the high-altitude balloon tracker device I have built.
TL;DR: The maximum line-of-sight distance for LoRa transmissions (with the transmitter and the receiver on ground level) was ~16.5 kilometers, but the receiver device was able to decode packets from ~19.2 km away. The range will anyway be significantly extended once the transmitter ascends to higher altitudes. With this range and a battery life of over 7 hours in temperature of -24 C, the tracker transmitter device built for this project should be suitable for high-altitude ballooning.
Preface
In this post, I will be going through the results of LoRa radio transmission tests I have conducted to find the maximum range for the transmissions of a high-altitude balloon tracker device. The tracker device and the software it runs are documented in the previous posts: part 1 and part 2.
Testing the range of weak, milliwatt-level signals in the UHF (ultra-high frequency) range (~434 MHz in the 70 cm band) requires clear, line-of-sight visibility between the radio transmitter and the receiver, because radio waves in the UHF range travel mostly along a straight line and do not bend like waves in the HF (high-frequency, ~3-30 MHz) or even VHF (very high frequency, ~30-300 MHz) range. Any trees, terrain or buildings on the path between the transmitter and the receiver will attenuate or completely block the signal. This will not be an issue when the tracker device is floating in high altitudes during a balloon flight, but finding a suitable place to test the line-of-sight range on ground level was definitely a challenge for me, since the landscape in southern Finland is quite flat and most areas are covered with forests.
Test setup
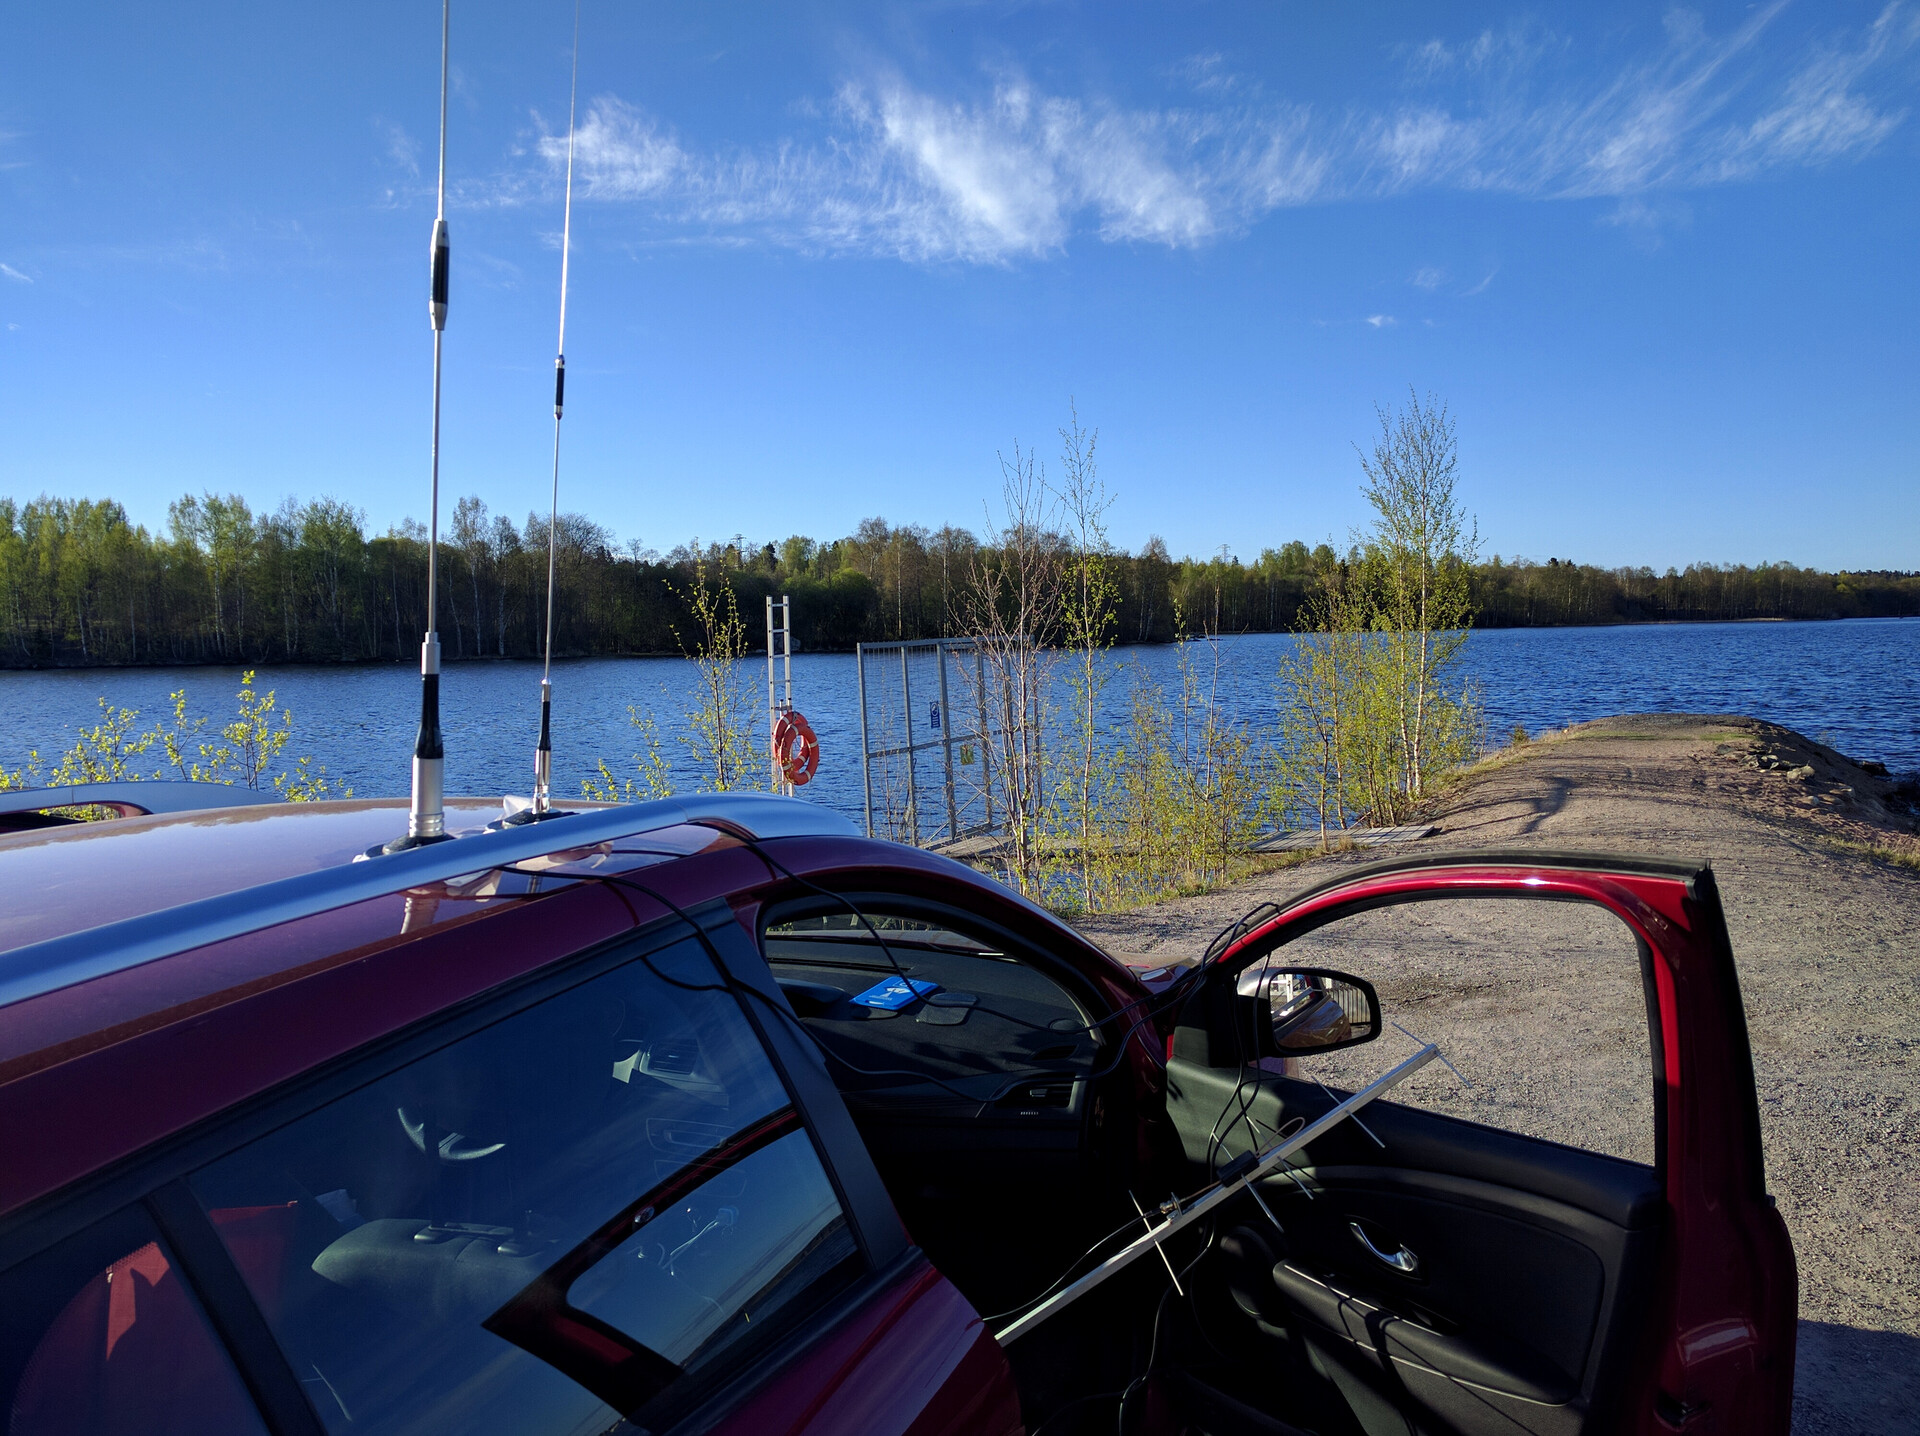
The LoRa transmission range tests presented here attempt to simulate what happens during a balloon flight: the transmitter device is placed in a place that is in high position above the ground and where there is a clear line-of-sight path between the transmitter and receiver in most locations where the receiver used. The receiver device is placed inside a moving "chase car" with its antenna mounted on top of car roof. On an actual flight, the transmitter will be moving constantly, carried by winds, but it is very difficult to replicate the movement with this kind of tests.
Transmitter device hardware
Here is a summary of the final tracker hardware used in the tests:
-
Raspberry Pi Model A+
-
Raspberry Pi Sense HAT
-
Raspberry Pi GPS HAT with a UBlox MAX-M8Q GPS chip
-
Sparkfun GPS Embedded SMA active GPS antenna
-
Raspberry Pi+ LoRa™ Expansion Board with a single 433 MHz RFM96W module
-
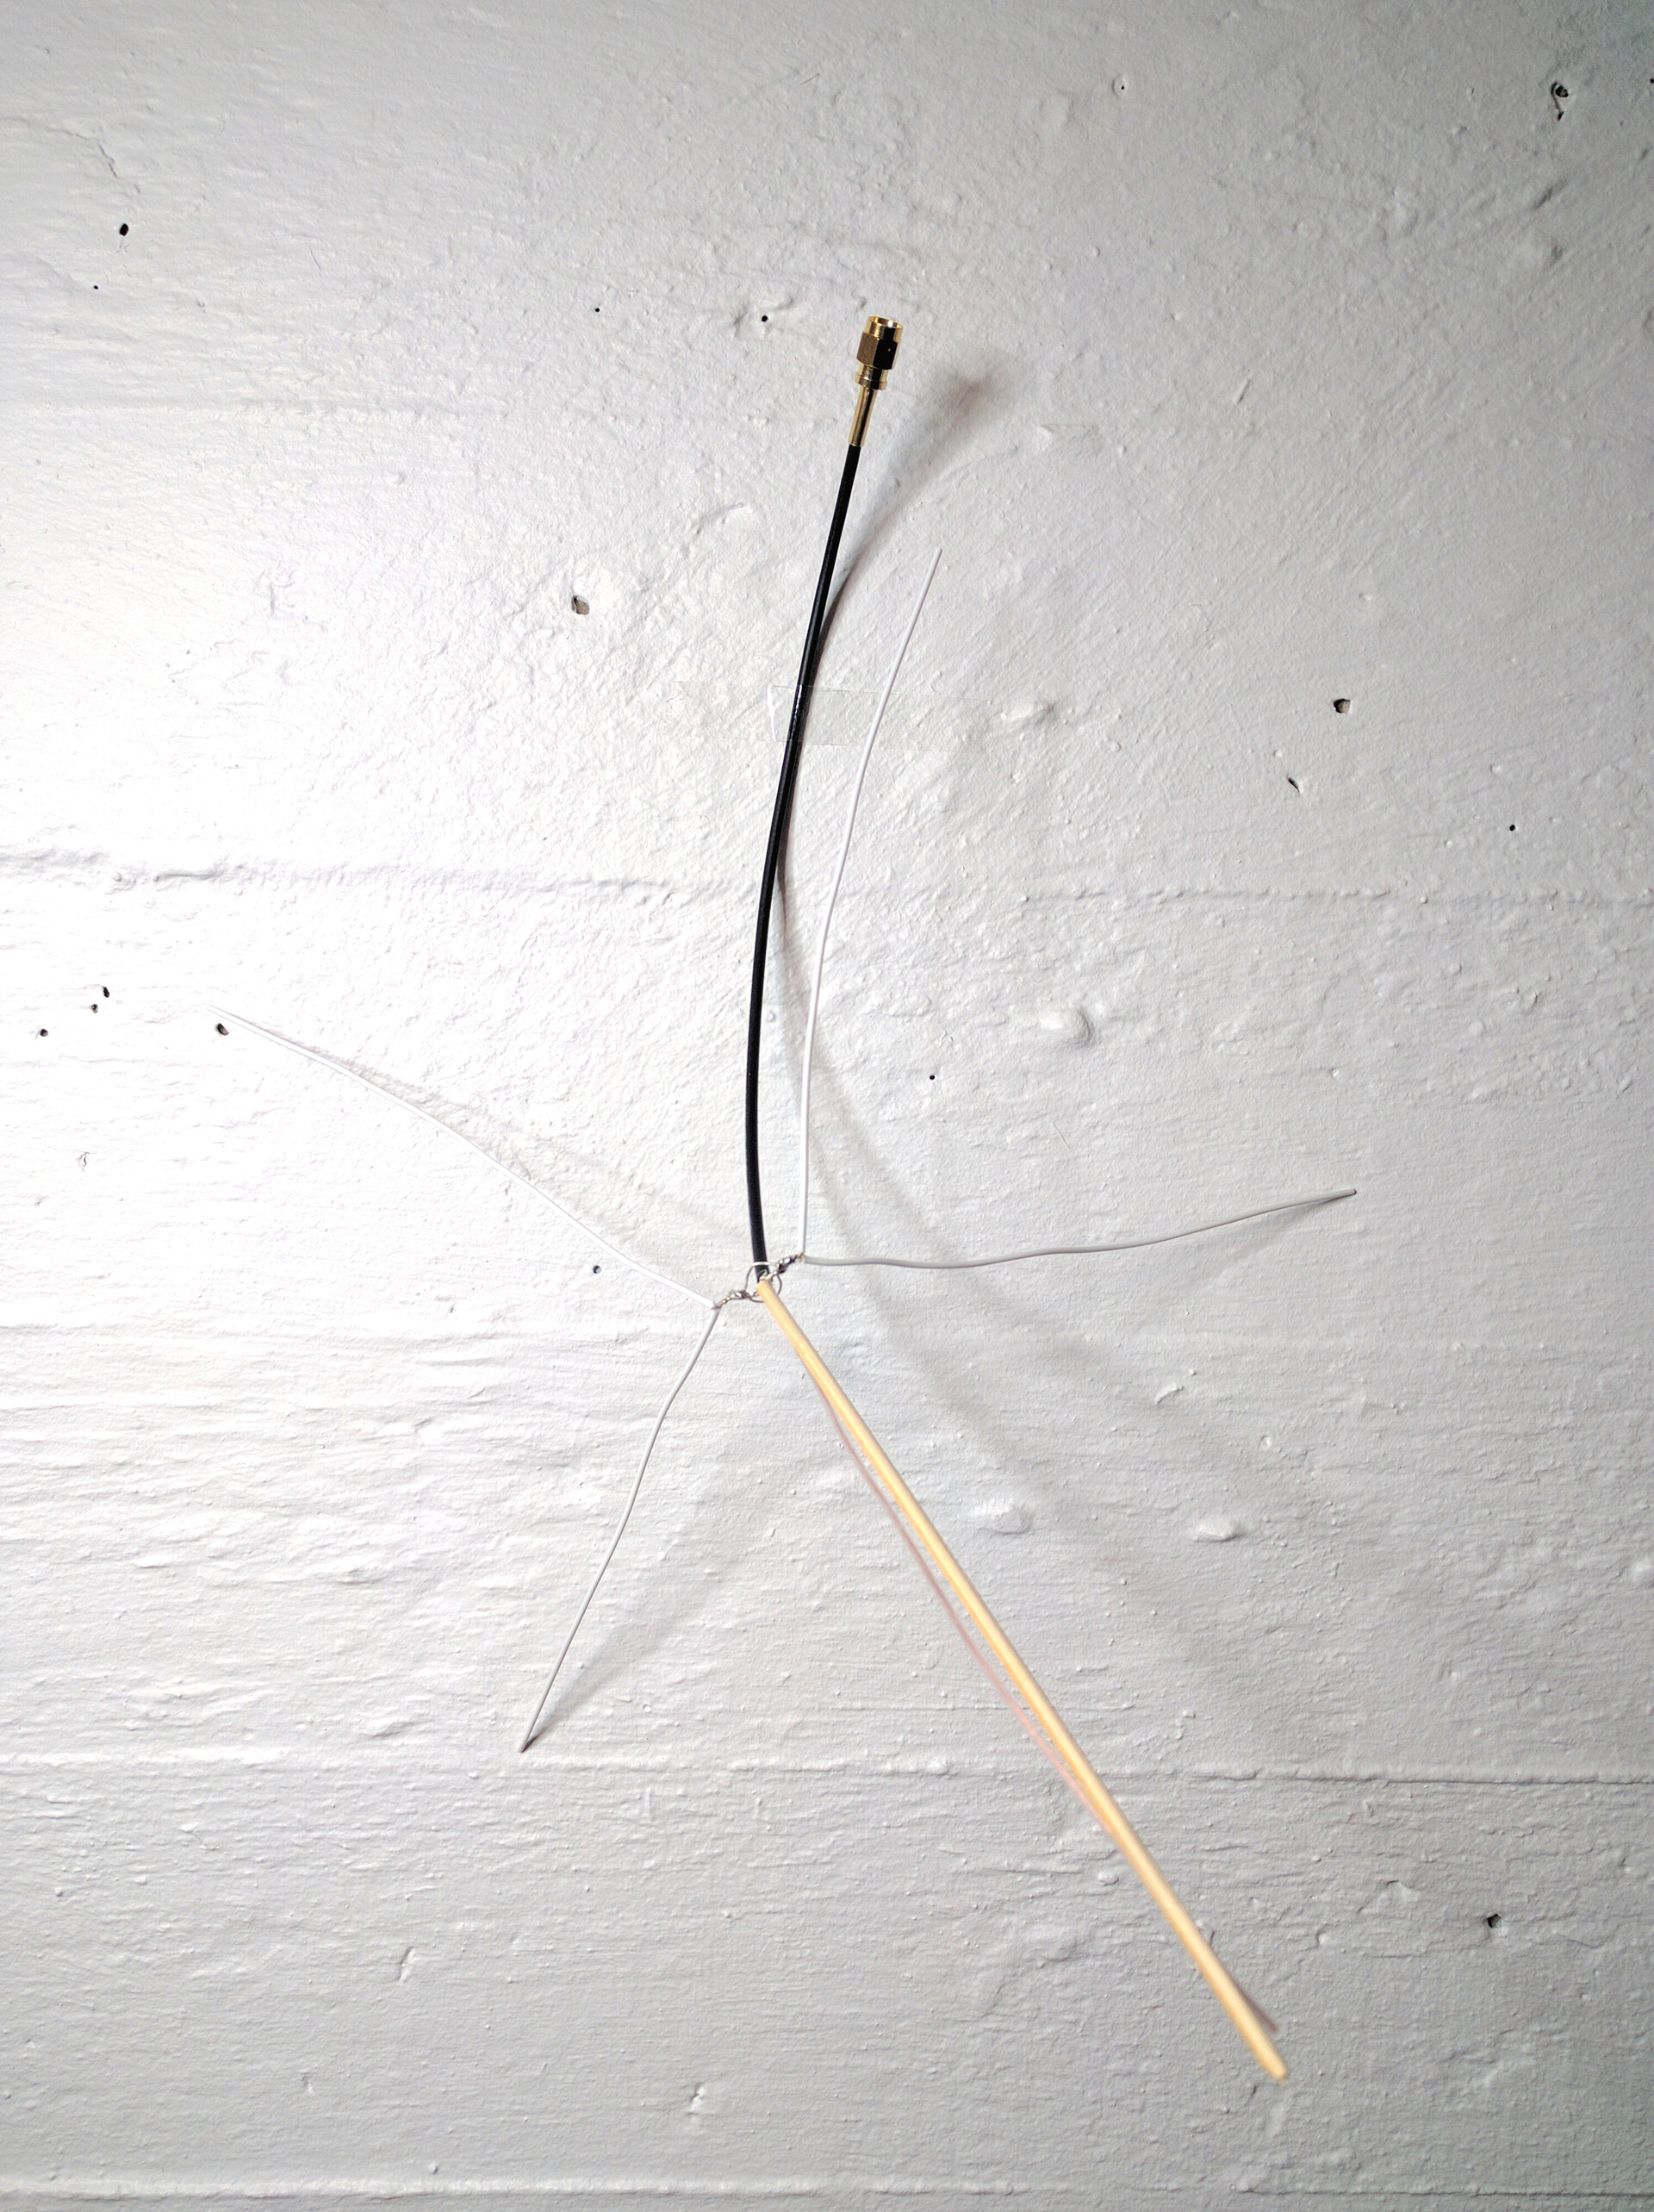
A 1/4-wave ground-plane antenna tuned for 70 cm band LoRa transmissions, built according to UKHAS payload antenna instructions
-
A mini WLAN USB dongle for monitoring the device while testing
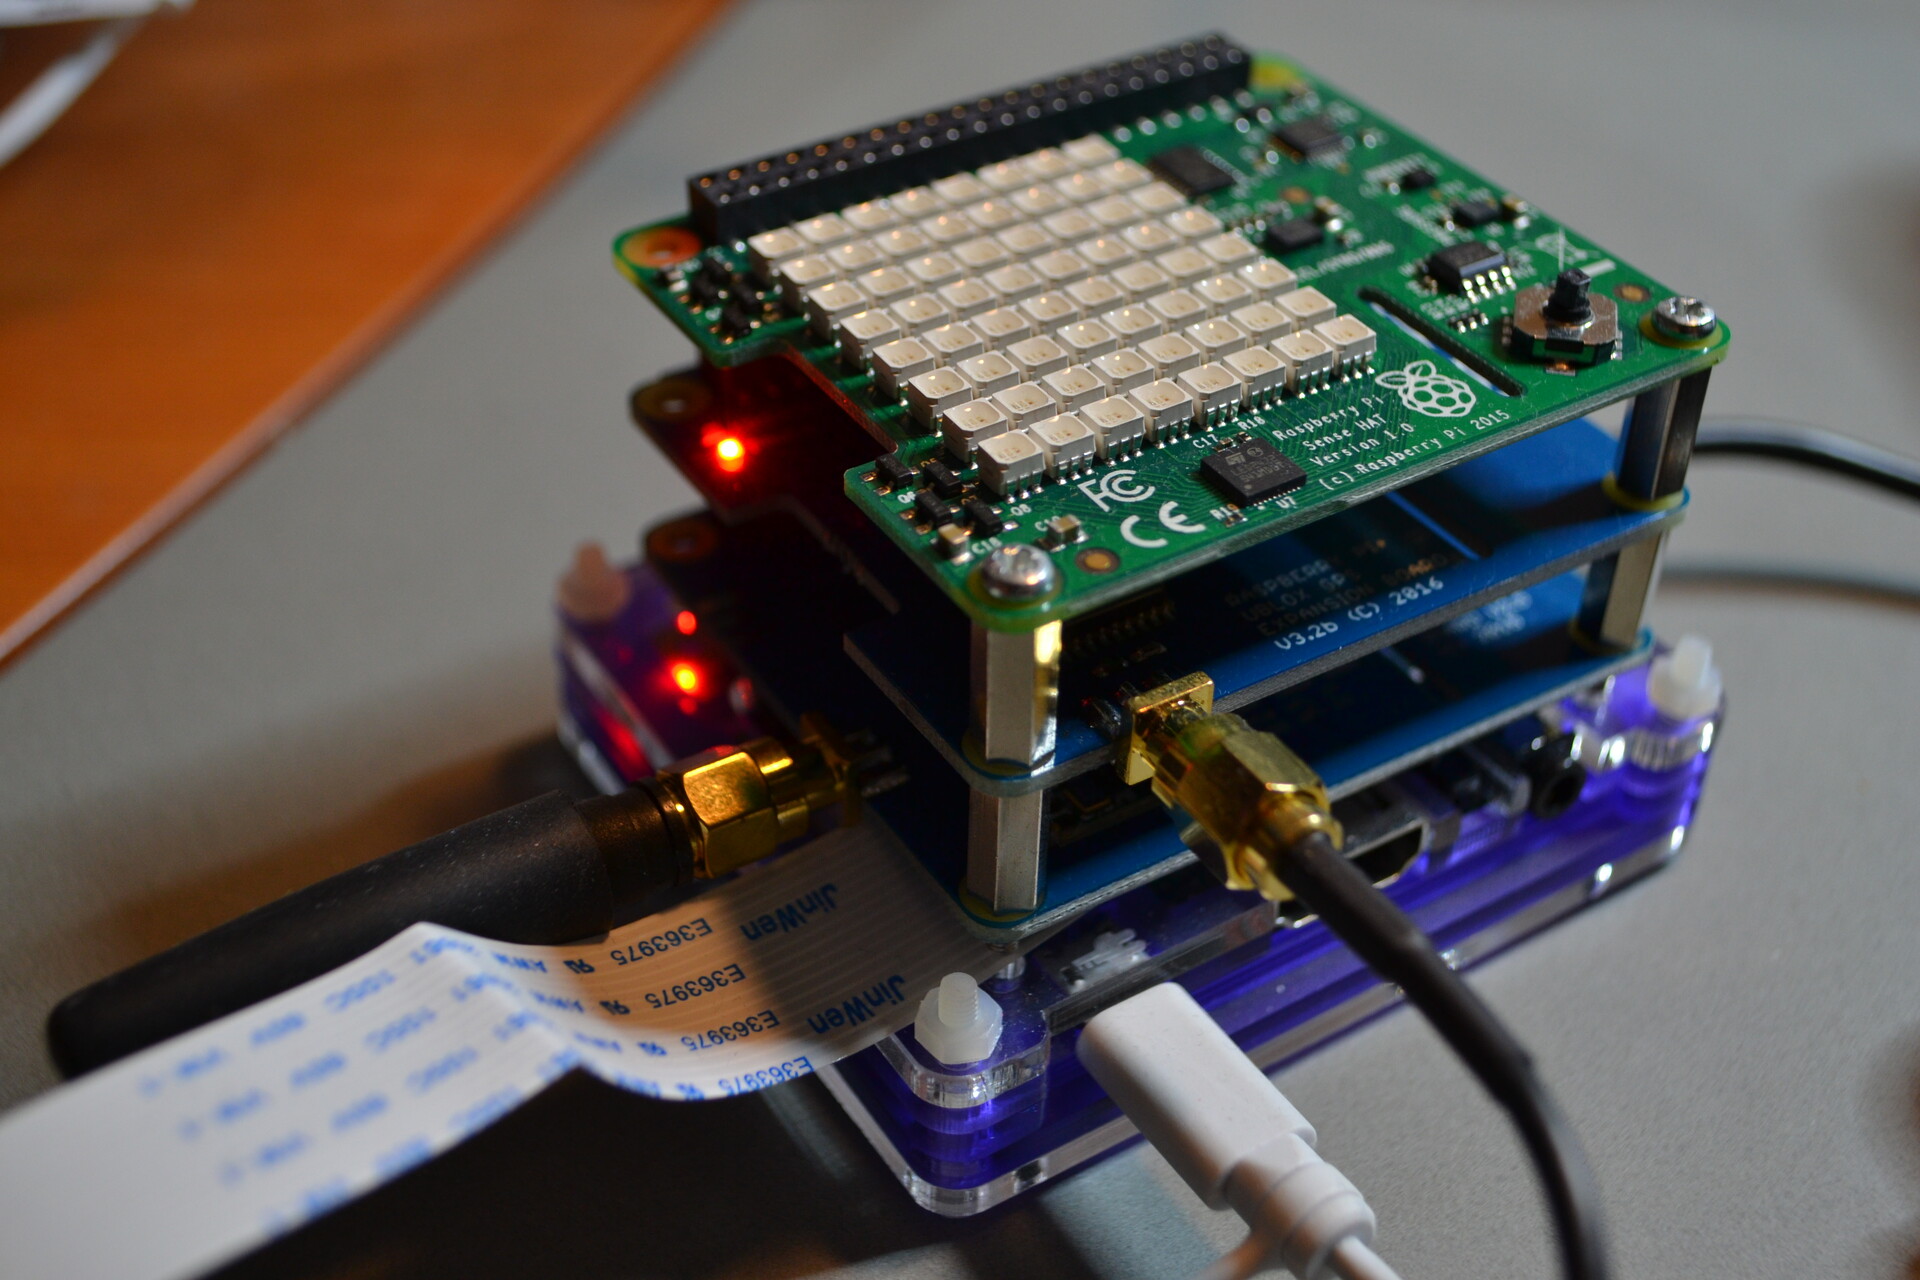
The only custom-made part of the tracker is the antenna that I built according to UKHAS payload antenna instructions. The antenna is very simple: the radiating element is made of RG174 coaxial cable center conductor and the ground plane radials are pieces of single-core wire.

Receiver device hardware
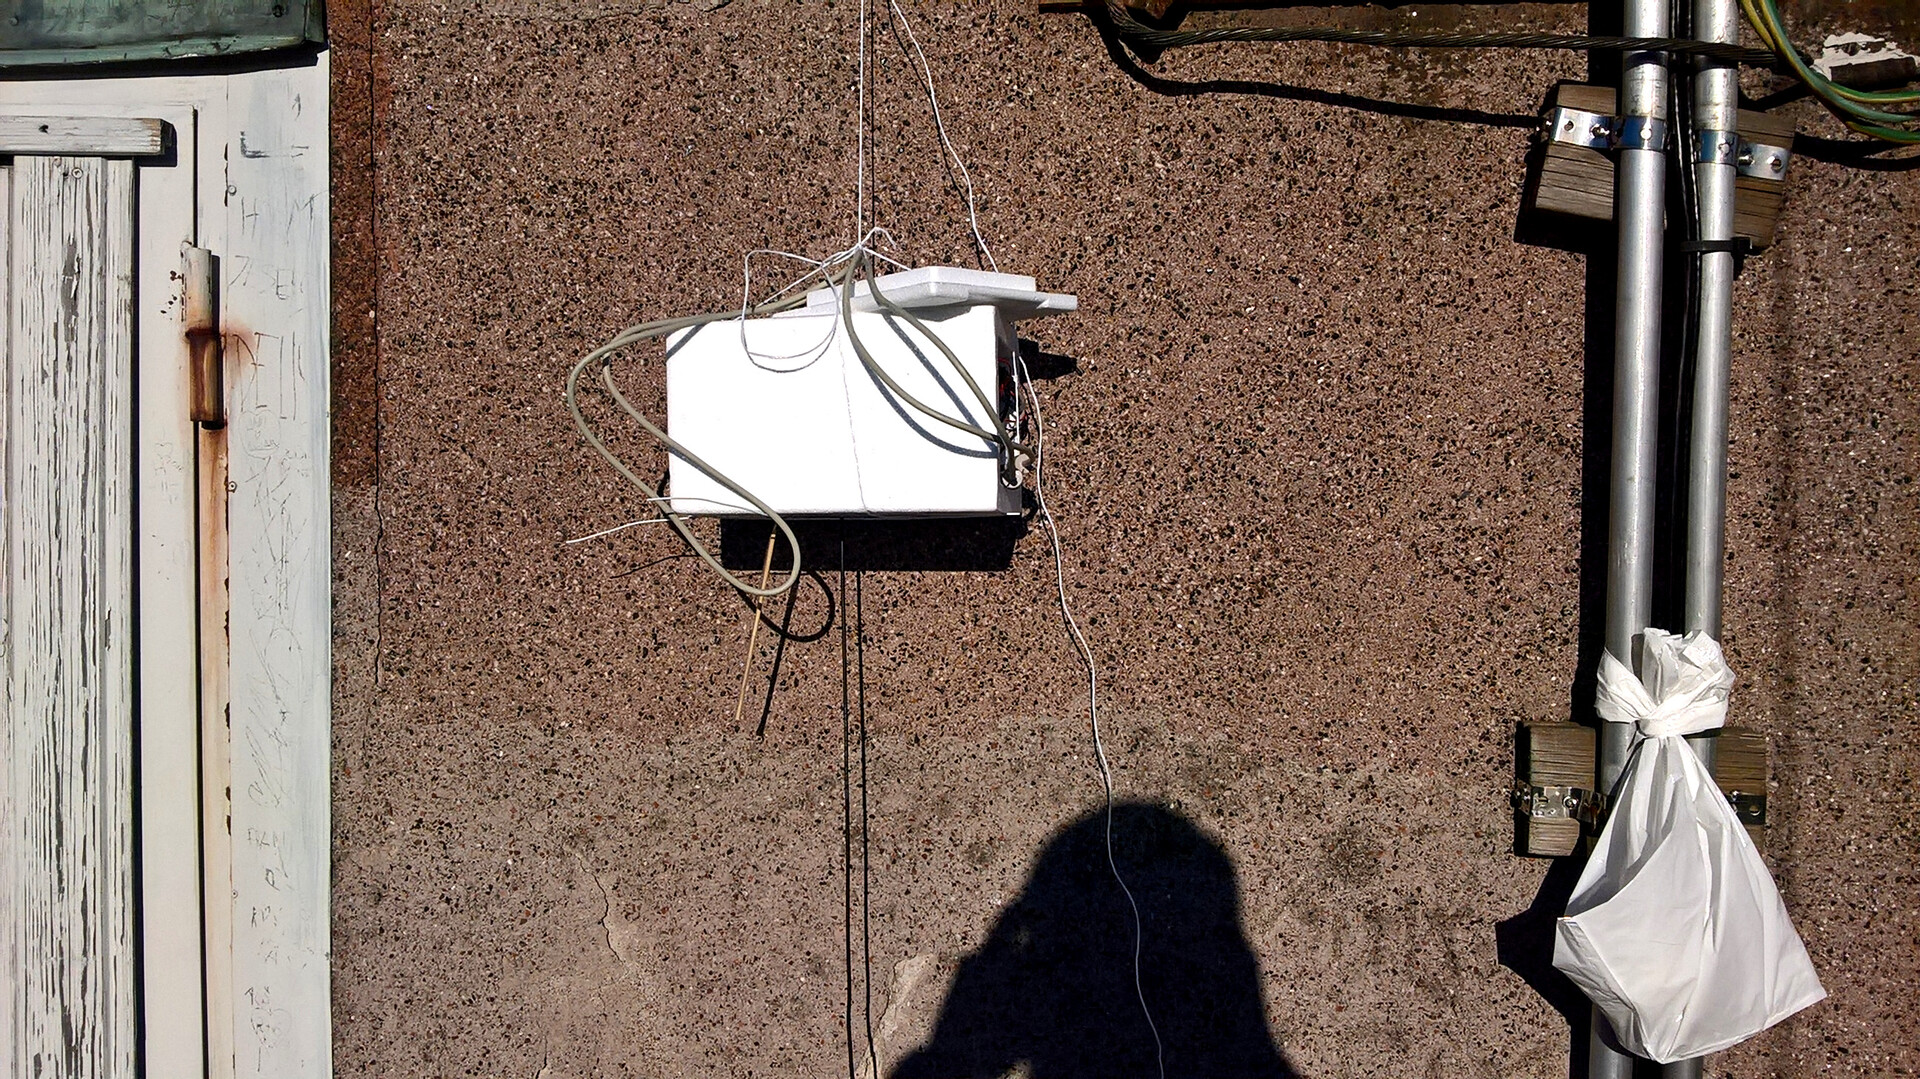
The two receiver (gateway) devices I’ve built use mostly the same hardware: the Raspberry Pi and the LoRa HAT are identical to the transmitter. I have placed both receiver devices insinde plastic enclosures in order to keep them safe during car rides.
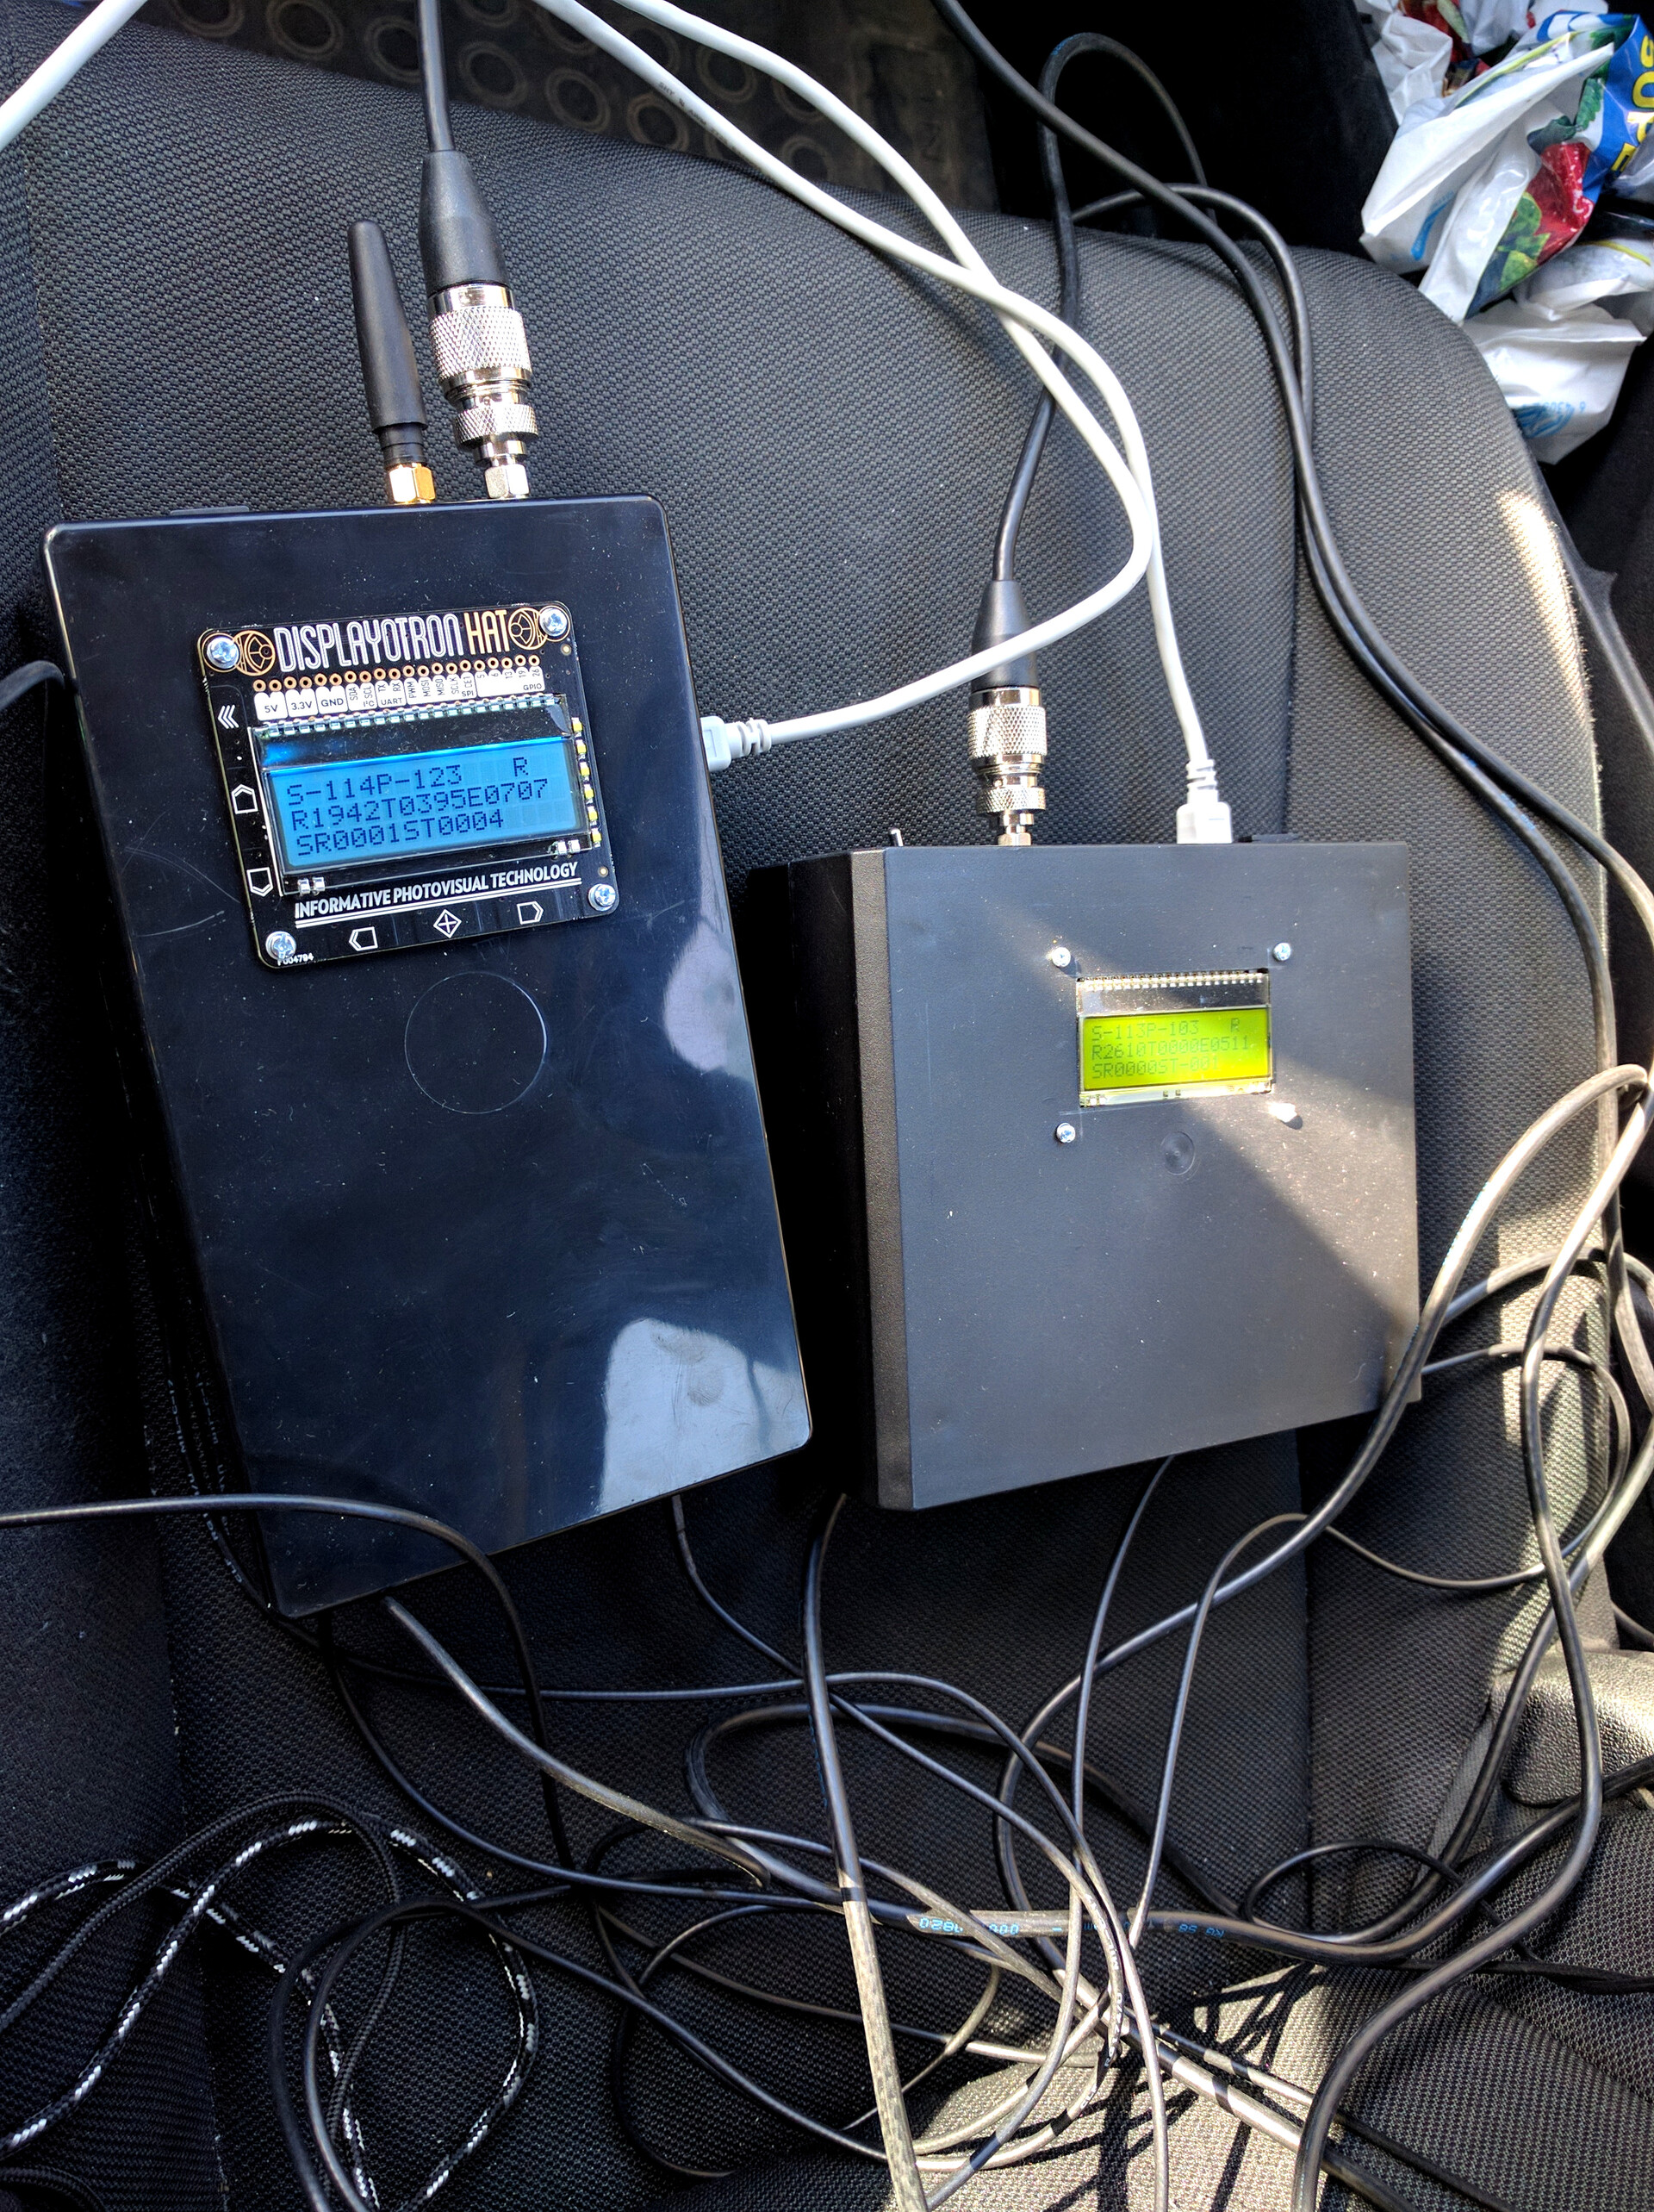
The only difference regarding LoRa signal reception are the antennas I used for testing. Because the devices are used in a chase car during a balloon flight, I opted to use magnetic mounts for the antennas so they can be placed on top of car roof. The antennas I used were a Diamond AZ510 dual-band (2 m / 70 cm) mobile antenna and a slightly taller Diamond SG7900 dual-band antenna.
After swapping antennas for a couple of times, my conclusion was that I did not notice any significant difference between the mobile antennas, so the I ended up using the shorter and lighter AZ510 for obtaining the test results below.
Test day 1
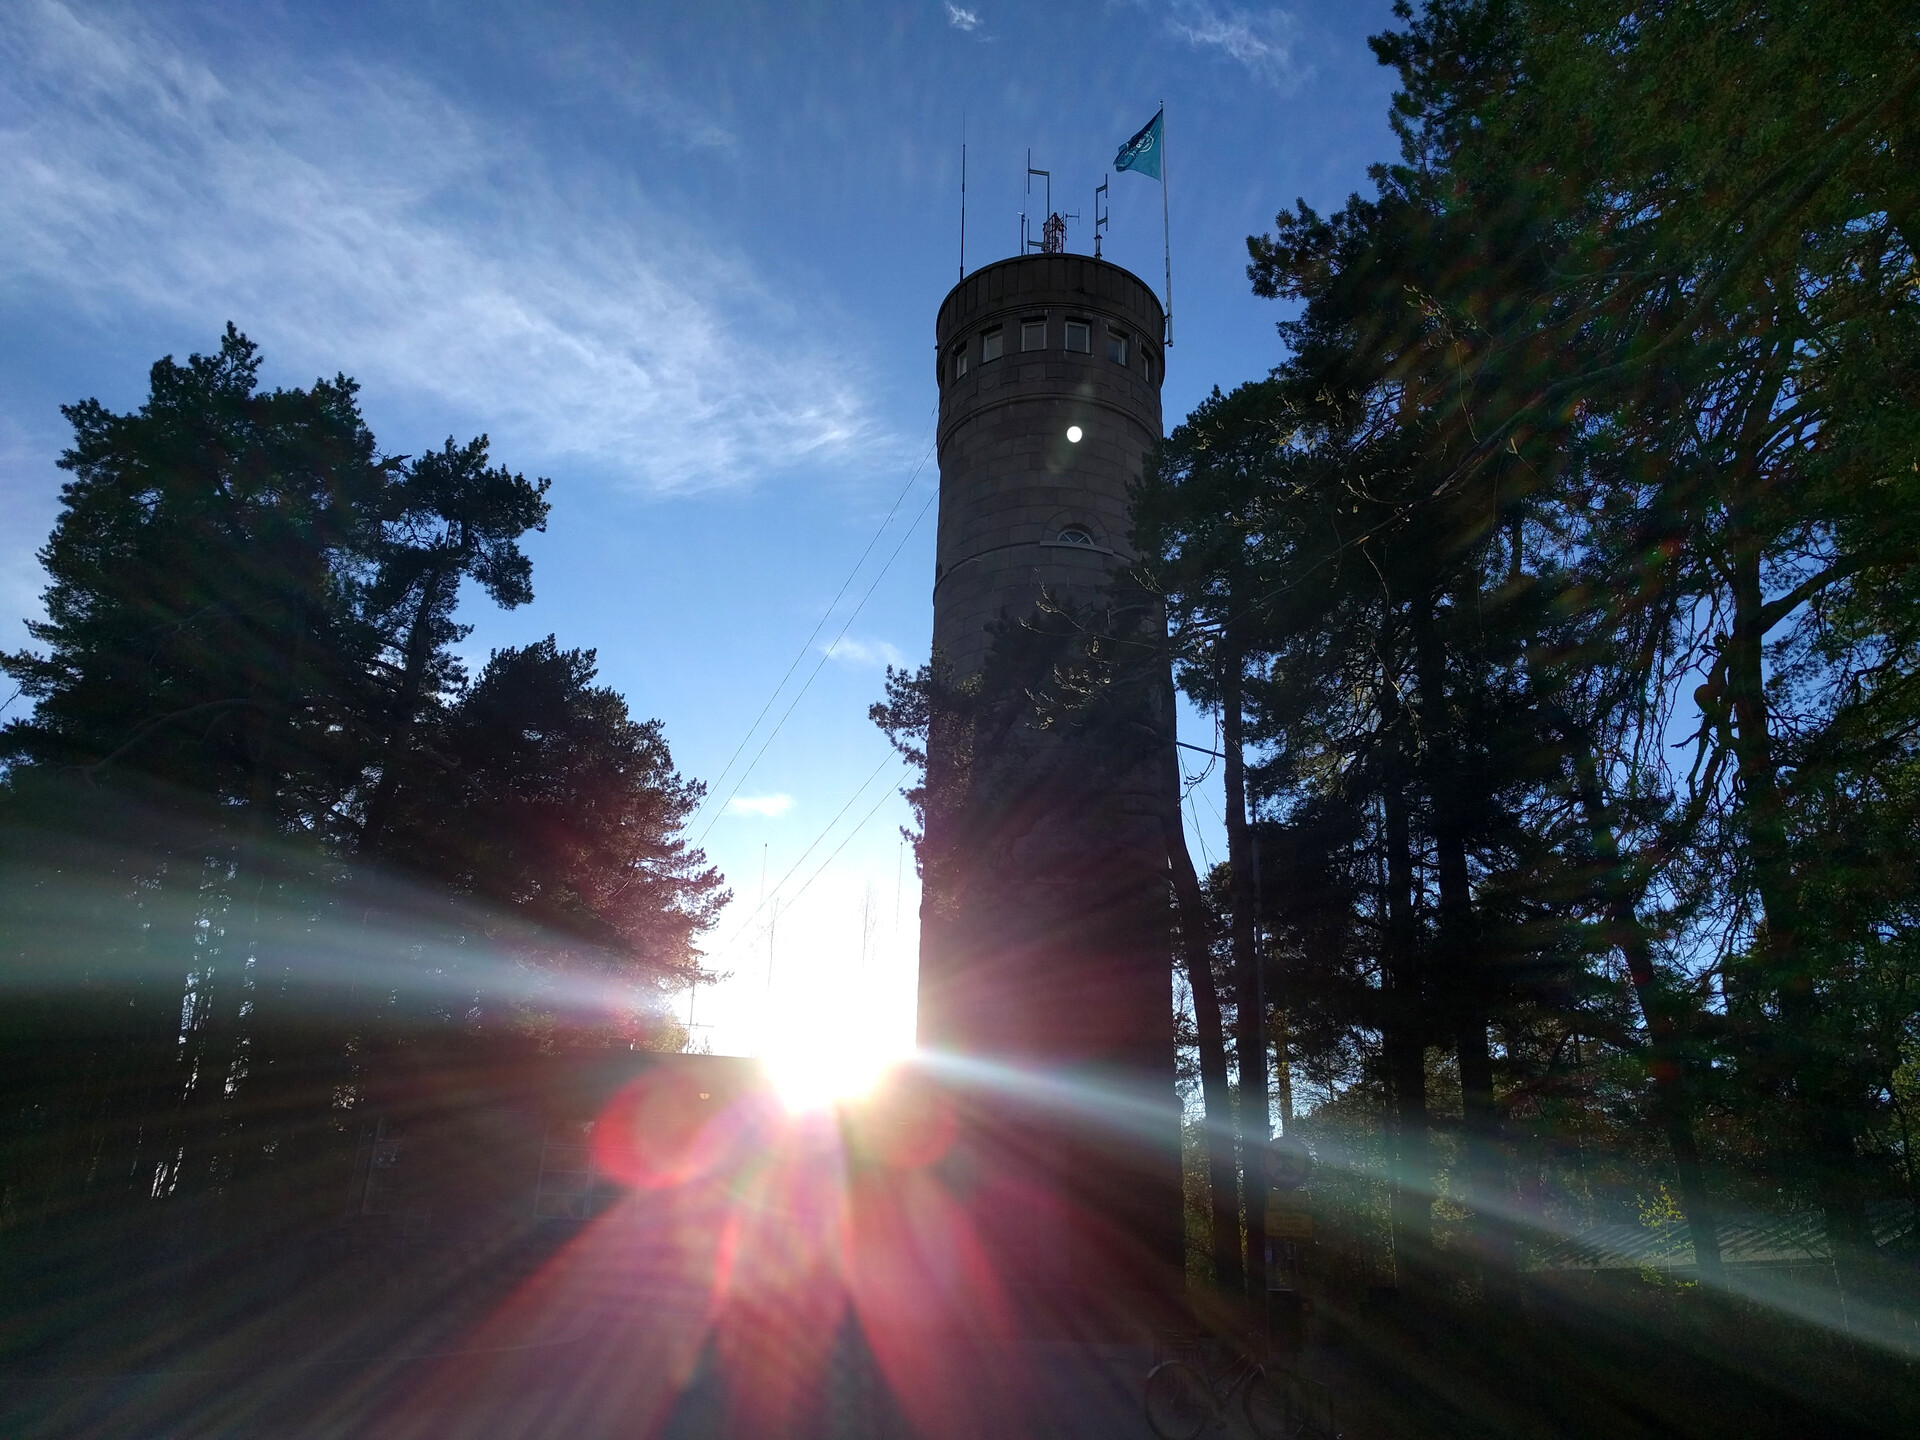
The first test day took place in the city of Tampere, since we found an excellent place for the transmitter: the Pyynikki observation tower, which provides an unobstructed view over the lakes surrounding Tampere.


The LoRa transceiver chip is very configurable, so I tried to find a good balance between the transmission time of a single 255-byte LoRa packet and the reliability of reception by keeping the bandwidth narrow. With a bandwidth of 62.5 kHz, spreading factor 7 and error coding rate of 4:5 I was able to reach a transmission time of ~800 milliseconds for a full packet. Having a packet transmission time under 2 seconds is important, because the tracker antenna will swing because of winds, which may cause fading in the signal.
The following were the LoRa chip configuration used during the first test day:
pa_boost: true
pa_output_power: 15
pa_max_power: 7
frequency: 434.250 # MHz
implicit_header_mode: false
error_coding_rate: "4:5"
bandwidth: "62K5"
spreading_factor: 7
crc: true
preamble_length: 8
Results
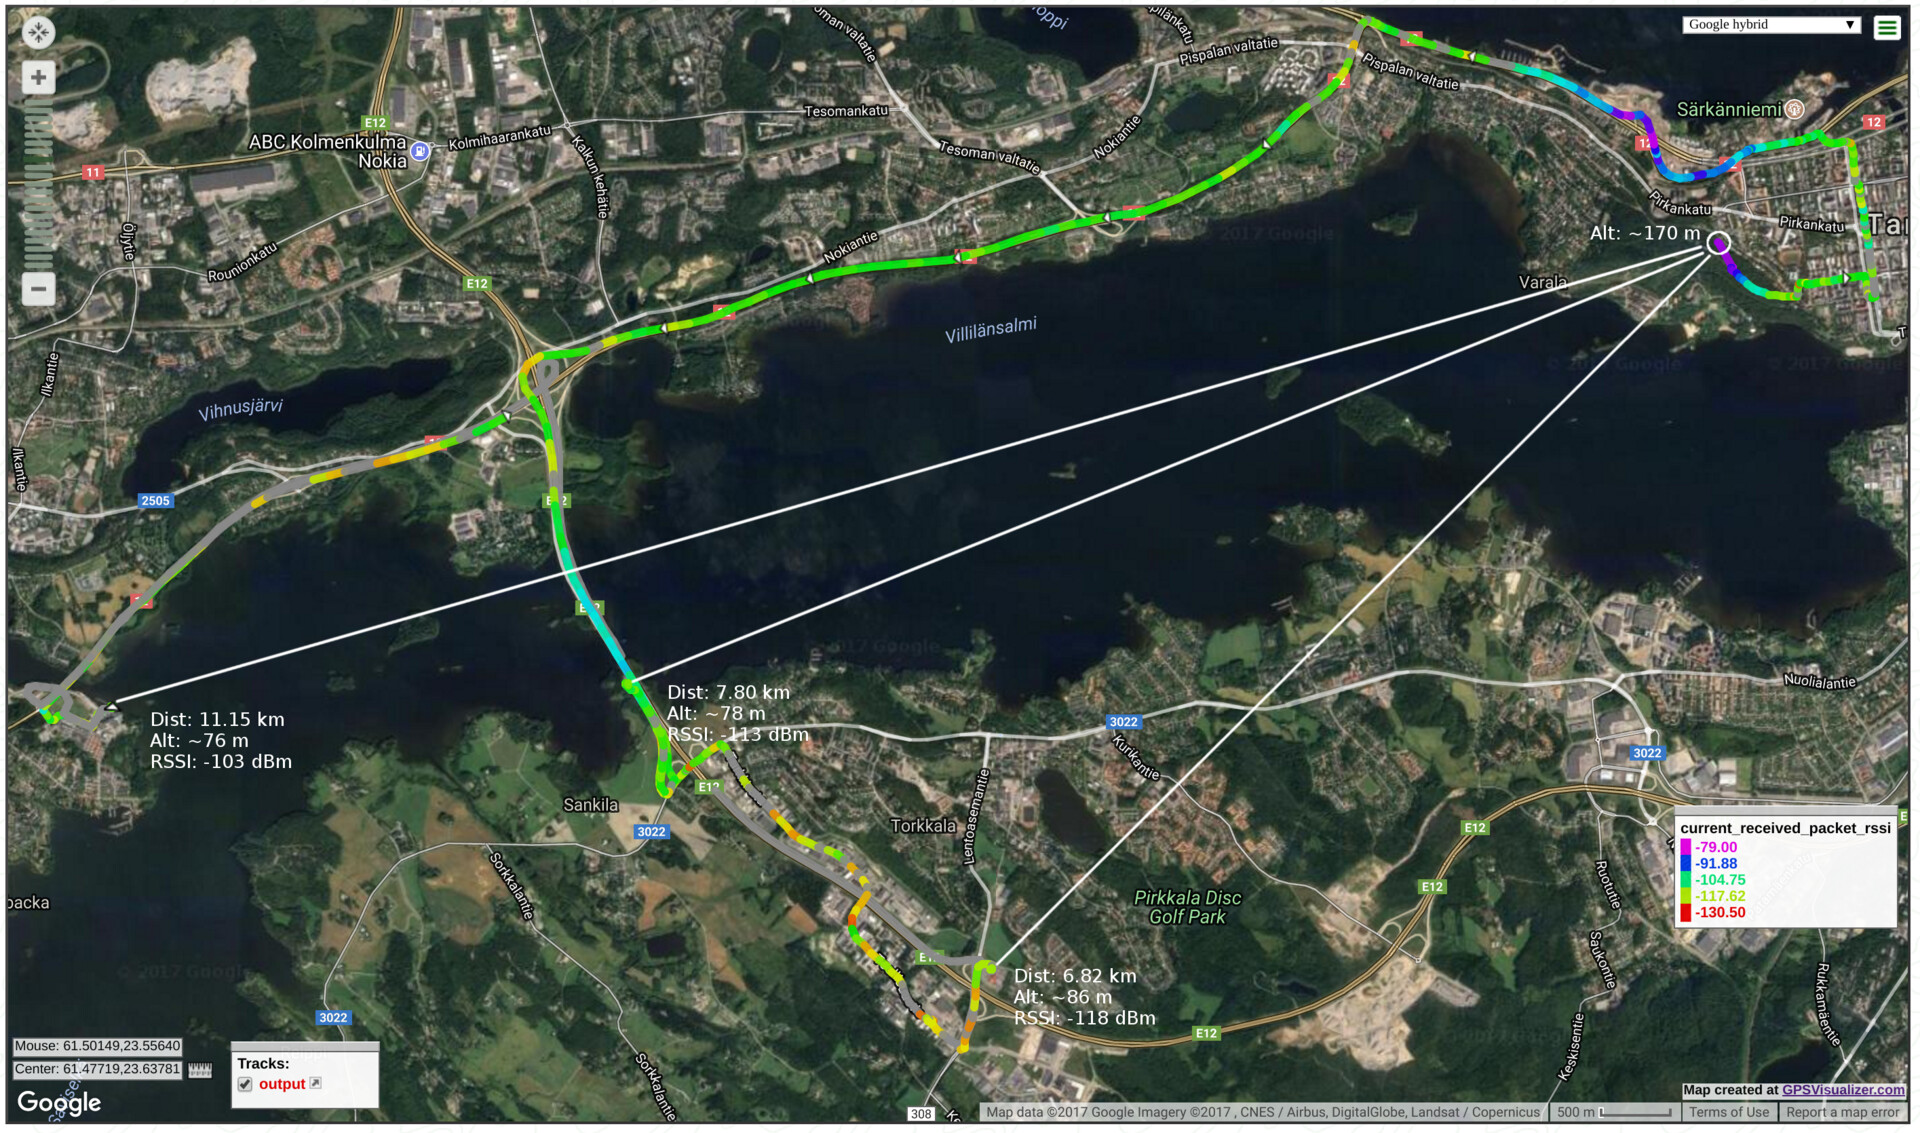
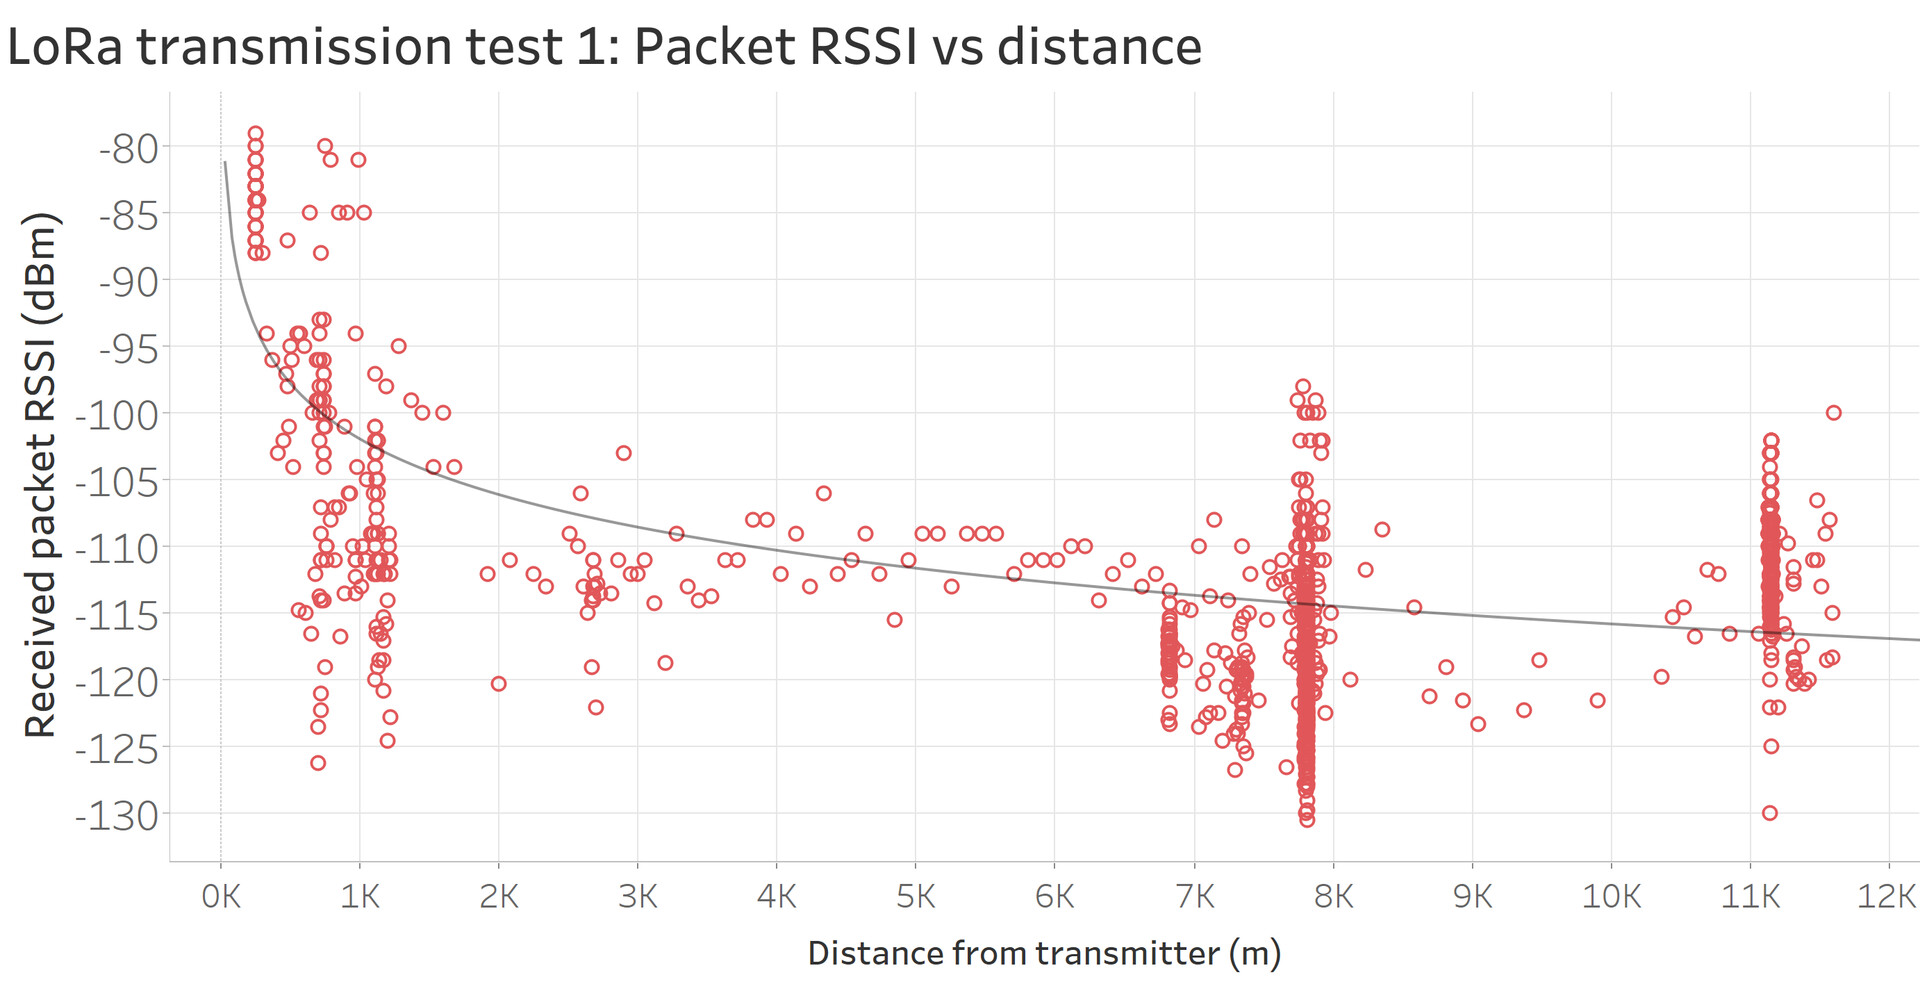
The maximum line-of-sight distance I could achieve easily by driving public roads was a little over 11 kilometers. While most of the telemetry packet transmissions were received correctly, I was not able to receive complete images.
The following map, generated using an excellent tool called GPS Visualizer, presents color-coded RSSI (Received Signal Strength Indicator) readings from the receiver device. Gray color indicates no reception. The unit of the RSSI values in these measurements is dBm, which means decibels of power referenced to one milliwatt: 0 dBm is 1 mW (milliwatt), -30 dBm is 1 µW (microwatt), -60 dBm is 1 nW (nanowatt) and so on. The maximum (theoretical) sensitivity of the LoRa receiver using the LoRa configuration listed above (with spreading factor 7) is -127 dBm (based on the estimate given by LoRa Modem Calculator Tool by Semtech).
The graph below represents the RSSI readings at a specific distance:
While the test was successful, the limited visibility caused by terrain and forests did not provide a good environment for testing the true limits of LoRa, so I started searching for a more suitable place for doing a second round of tests.
Test day 2
The second test day took place in Eastern Finland in Kesälahti, around lake Puruvesi. The lake provides line-of-sight conditions for distances over 16 kilometers.

For the second test day, I changed LoRa settings to use spreading factor of 8 for additional receiver sensitivity. The transmission time of a single LoRa packet went up to ~1414 milliseconds, which was still acceptable, when trying to keep the time below 2 seconds.
pa_boost: true
pa_output_power: 15
pa_max_power: 7
frequency: 434.250 # MHz
implicit_header_mode: false
error_coding_rate: "4:5"
bandwidth: "62K5"
spreading_factor: 8
crc: true
preamble_length: 8
Results
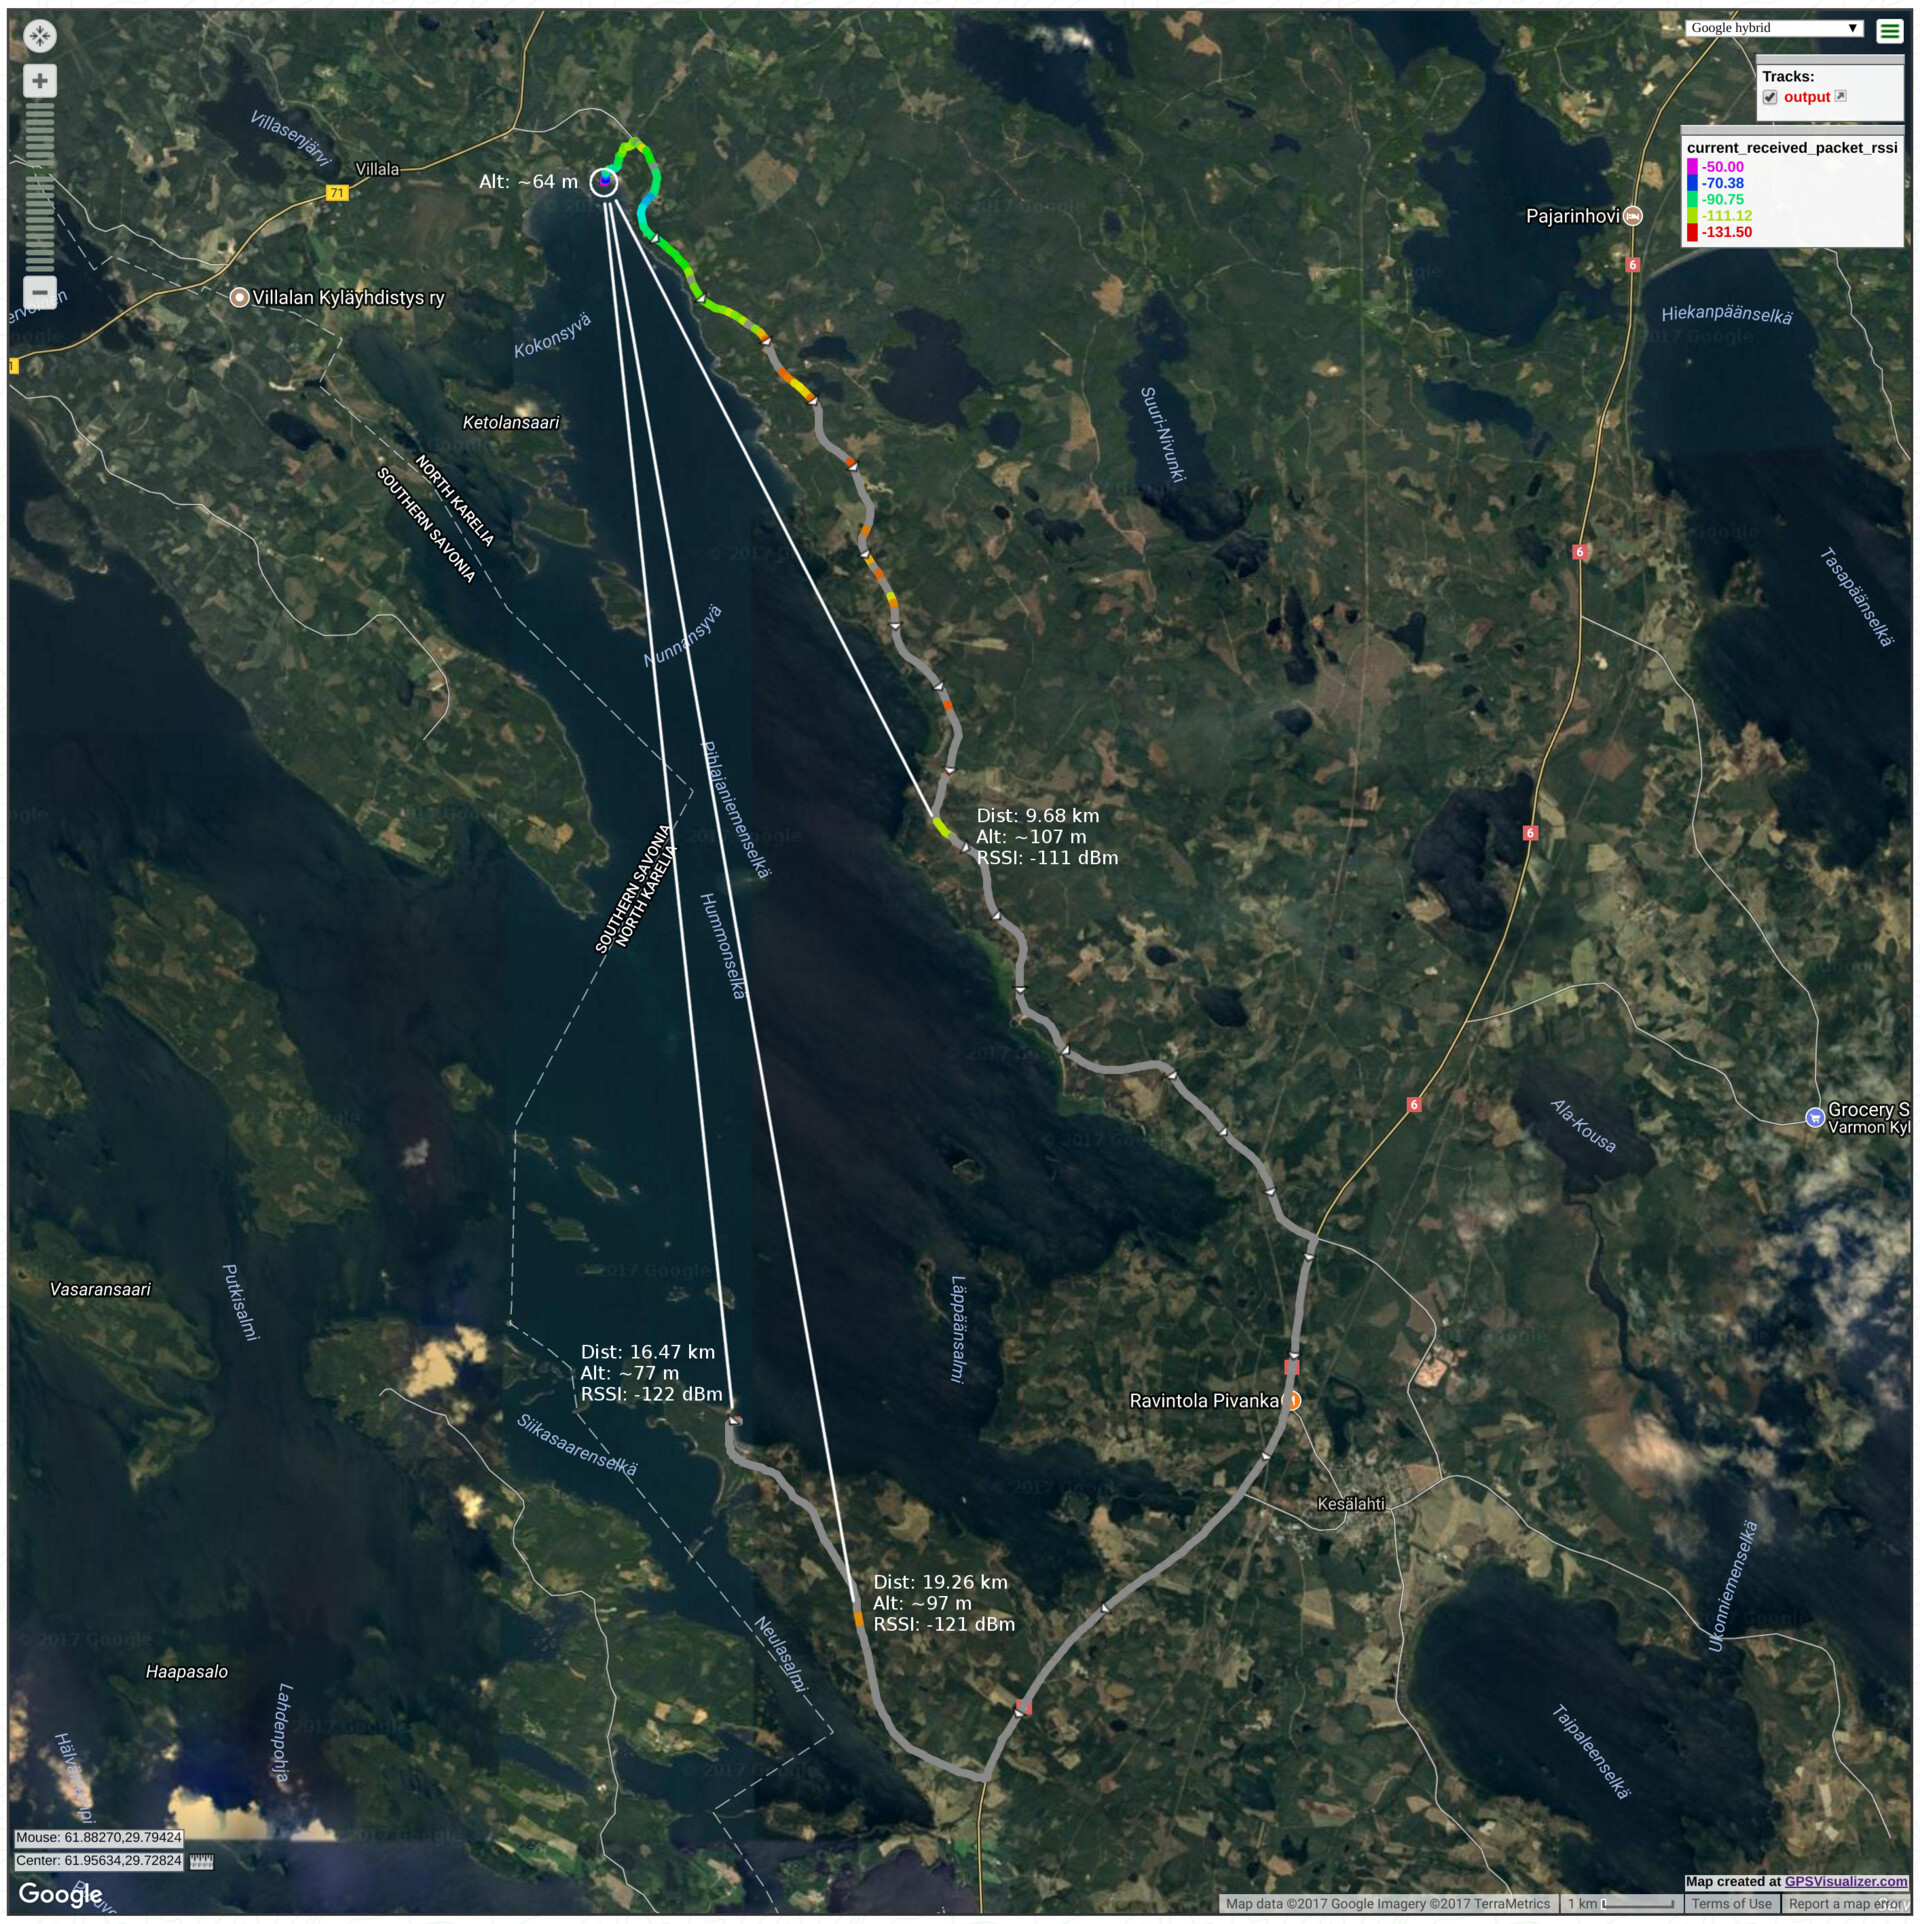
This time the maximum line-of-sight distance was ~16.5 kilometers, but the receiver device was able to decode packets from ~19.2 km away while I was driving. Reception was intermittent, so images were not successfully received at the maximum distance.
I had issues with the transmitter device freezing from time to time, because of a concurrency-related bug in the code I had written, so the results are not as conclusive as I would have hoped.
Again, the unit of the RSSI values in the measurements is dBm, which means decibels of power referenced to one milliwatt: 0 dBm is 1 mW (milliwatt), -30 dBm is 1 µW (microwatt), -60 dBm is 1 nW (nanowatt) and so on. The maximum (theoretical) sensitivity of the LoRa receiver using the LoRa configuration listed above (with spreading factor 8) is -130 dBm (based on the estimate given by LoRa Modem Calculator Tool by Semtech).
And the graph representing the RSSI readings at a specific distance:

Conclusions
While the total LoRa transmission range achieved in the tests gave some insight to the reliability of using LoRa for tracking high-altitude balloons, I was not completely convinced. Issues (that were later fixed) with the ERT software prevented me from doing proper comparison between different LoRa configurations.
To overcome the possible limitations in LoRa range, I decided to use a second tracker as a backup in case I’m not able to receive LoRa transmissions. The Trackuino backup tracker is documented in more detail in the next blog post.
Links to other LoRa range tests
While doing my research on testing LoRa, I found good resources about experiments and tests on LoRa transmission range in different environments:
Tracker battery life
Another important factor in accomplishing a successfully tracked flight is to ensure the tracker device is powered for the entire flight. Raspberry Pi and the add-on HATs I’ve chosen for the tracker have relatively high power consumption, because this project aims to use off-the-shelf components to avoid the need to design or build custom PCBs. However, the high power consumption should not be an issue, since the duration of a balloon flight is usually around 3-4 hours: achieving battery life of 6 to 7 hours will be enough, assuming the payload will be recovered soon after landing.
Optimizing power consumption
There are several ways to configure Raspberry Pi to conserve power. You can:
Raspberry Pi CPU and GPU operating frequencies can also be adjusted, but - based on my measurements - lowering the frequencies had only a negligible effect on power consumption. There are also more advanced methods to reduce power consumption, e.g. by changing the voltage regulator of the Raspberry Pi board.
Power supply
Batteries powering the tracker have to be chosen carefully, since the effect of low temperature to batteries is often significant: the battery voltage may drop very quickly to a level that is not enough to power the tracker. I chose to use Panasonic Eneloop Pro rechargeable NiMH batteries, since they are widely available and rated for temperatures as low as -20 C.
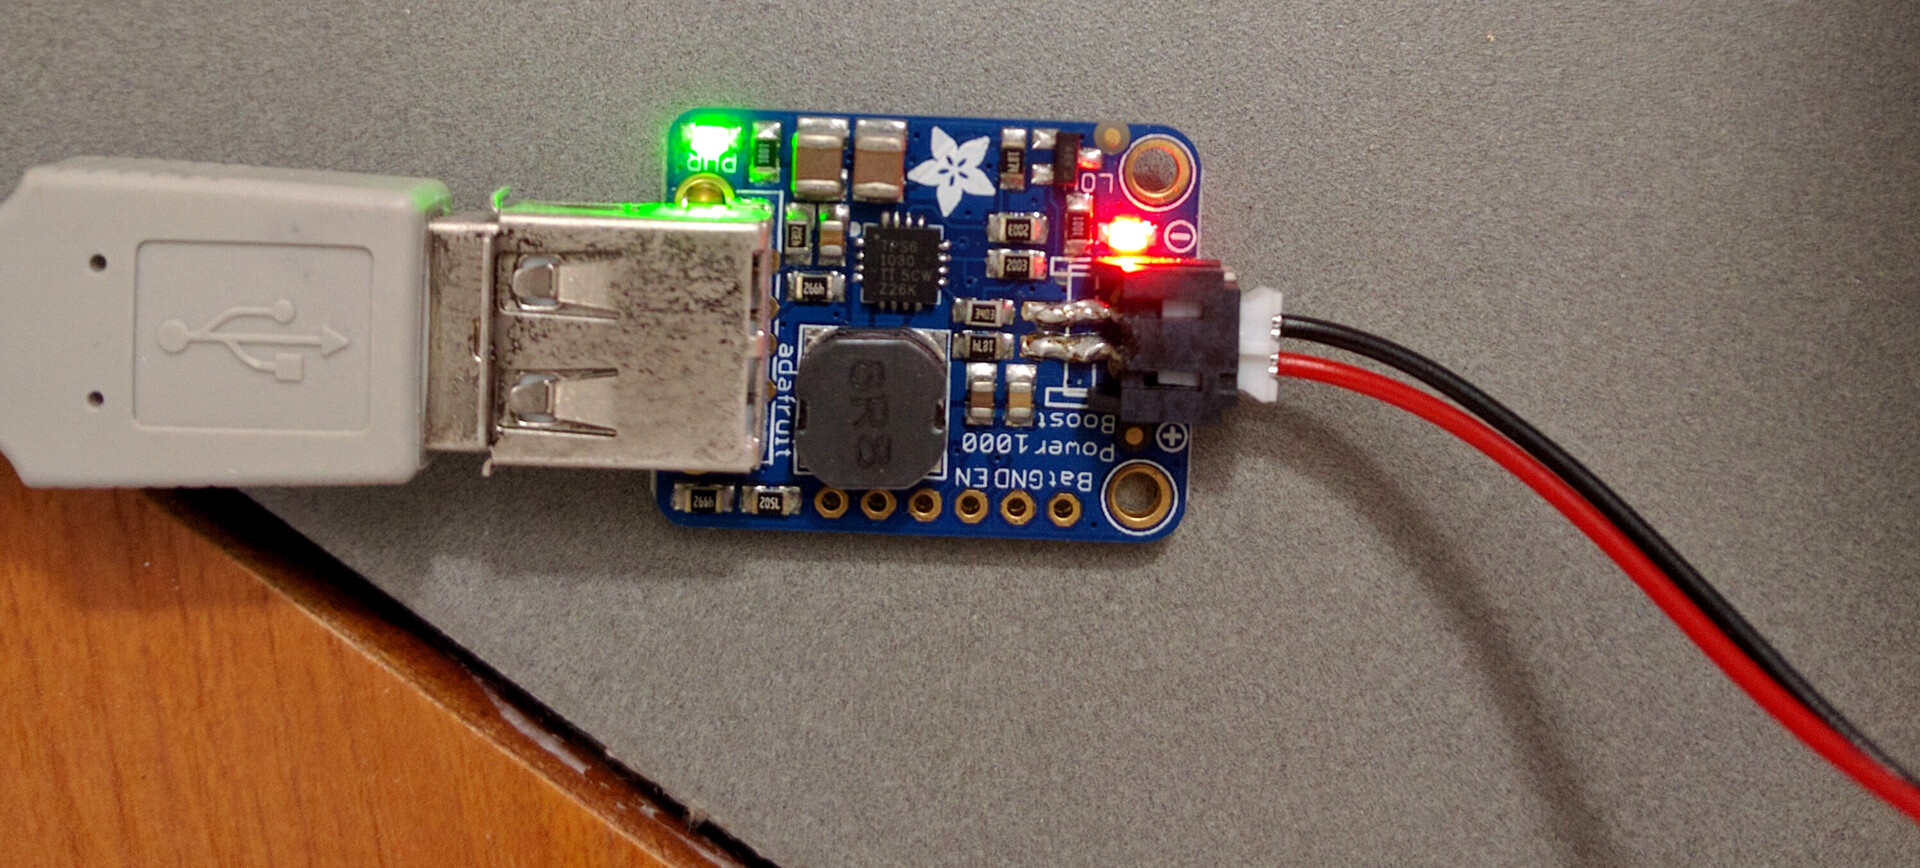
To supply steady 5V voltage for the Raspberry Pi micro-USB port, I used an Adafruit PowerBoost 1000 Basic voltage booster, which works with voltages as low as 1.8V.
Battery run-time test results
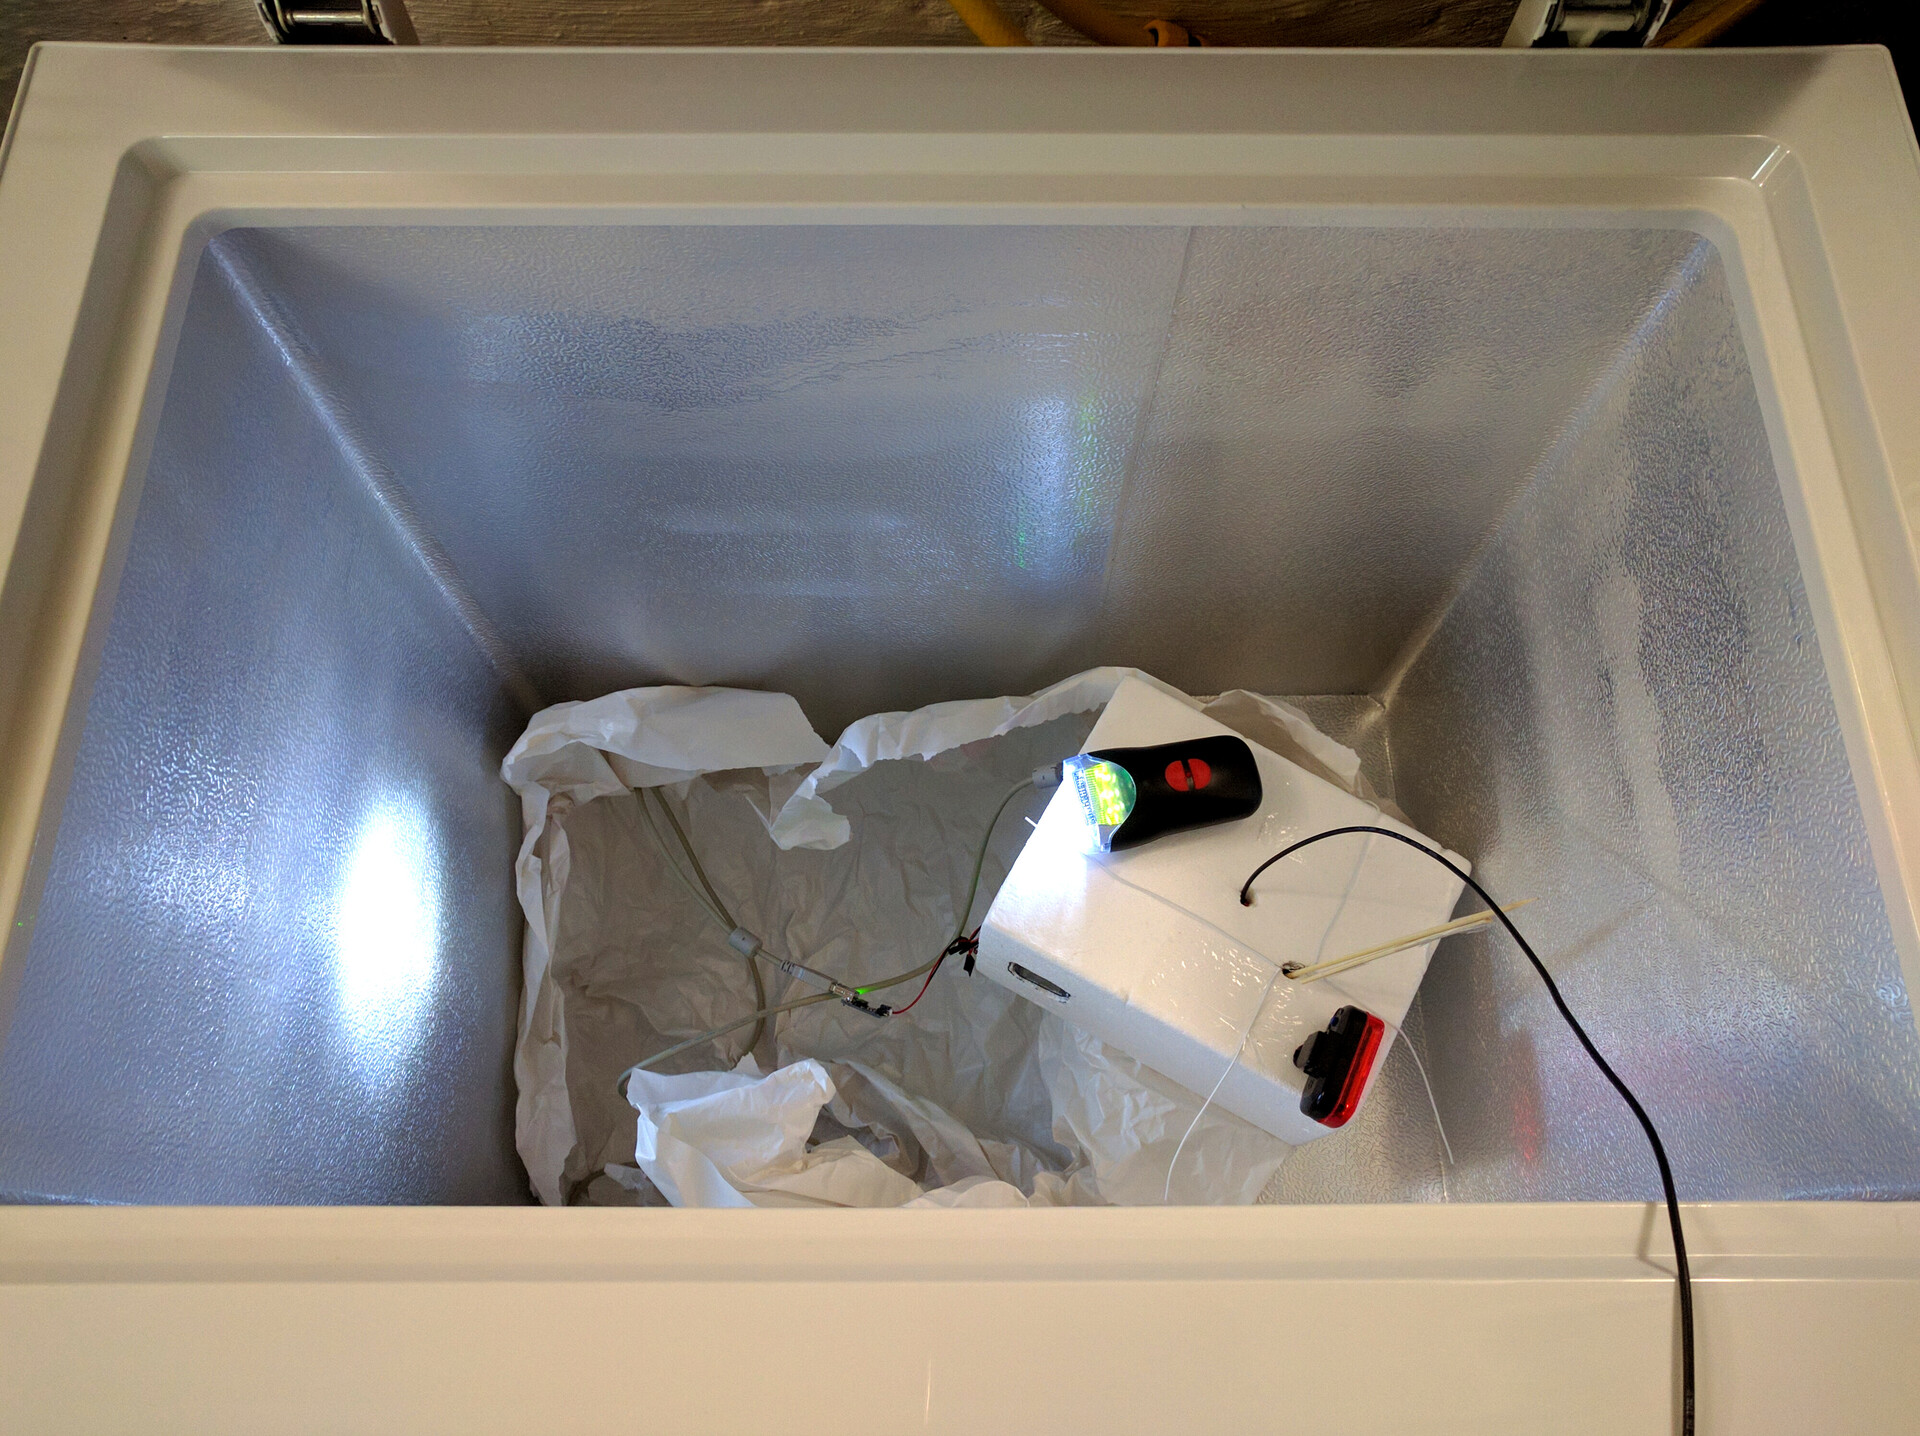
To simulate the cold temperatures of upper atmosphere layers, I decided to place the tracker (transmitter) device to a large freezer set to minimum temperature. That way I could reach a temperature of around -24 C. While it is a lot colder, up to -40 to -50 C, at an altitude of 30 kilometers, I left the payload enclosure (containing the device) open, so that the device was exposed to the raw temperature in the freezer.
Here’s a summary of the tested equipment:
-
Batteries: 4x Panasonic Eneloop Pro 1.2V 2500mAh
-
Voltage converter: Adafruit PowerBoost 1000 Basic → ~5.2-5.3V
-
The Raspberry Pi tracker device described above in this post
-
LEDs off, HDMI off, standard CPU frequency settings
-
A USB WLAN dongle was connected so I could occasionally monitor the state of the device
-
And the configuration used for ertnode tracker software:
-
10 seconds of sleep between sending telemetry messages
-
10 seconds of sleep between sending images
-
Transmit all-mode: Retransmits all data if the transmitter does not receive acknowledgements
-
LoRa packet acknowledgements were turned off in the receivers to simulate a condition where the transmitter cannot hear the acks sent by a receiver
-

The total running time for the tracker was 7 hours 18 minutes and 40 seconds, counting from the first received telemetry message to the last one. Over 7 hours of run-time is definitely enough for a balloon flight, so the test was a success: there was no need for further optimizations!
I also checked the power consumption of the tracker device, both with and without the USB dongle:
| LoRa transmitting | Voltage | Current | Power | Notes |
|---|---|---|---|---|
Yes |
5.13 V |
0.26 A |
1.328 W |
USB WLAN dongle connected |
No |
5.16 V |
0.10 A |
0.516 W |
USB subsystem disabled |
Yes |
5.14 V |
0.17 A |
0.873 W |
USB subsystem disabled |
No |
5.13 V |
0.19 A |
0.974 W |
USB WLAN dongle connected |
Here we can see that the both the LoRa radio transceiver and the WLAN dongle draw a significant amount of current: The LoRa chip consumes about 70 mA while transmitting and the WLAN dongle a total of 90 mA while being connected to an access point (without active TCP connections). It would be possible to extend the run-time even more by leaving out the WLAN dongle.
Next up
The next and final blog post in this series will focus on my first balloon flight. The post will walk through the steps to actually launch a high-altitude balloon and present photos and videos from the launch and flight.
You can follow me on Twitter at @mikaelnou where I will tweet about new blog posts when they are published.