Building Raspberry Pi HAB radio tracker software (part 2): Embedded Radio Tracker
This is the second part of a series of blog posts that follow and document my attempt to launch a high-altitude balloon (HAB) to perform aerial photography. The posts are focused on developing Linux-based software on Raspberry Pi for tracking high-altitude balloons. This post documents the internals of the tracker software called Embedded Radio Tracker.
TL;DR: The tracker software source code is available in GitHub along with build and installation instructions.
Preface
This post documents the internals of tracker software called Embedded Radio Tracker (ERT), which I am developing to track high-altitude balloons. The software is modular and configurable so it is basically a general-purpose radio tracker that can be extended and modified easily. In addition to tracking high-altitude balloons, it could be used to track vehicles or it could even function as a remote weather station. An introduction to this project and to the functionality of the tracker software can be found in the previous post.
NOTE: The project in its current state can be considered as a proof-of-concept implementation, since it has been tested very lightly and there are only few automated unit tests for the code. The codebase ended up becoming much larger than I anticipated, so there may be some hairy pieces of code left :)
What is it?
The project consists of two applications:
-
ertnode— a tracker application transmitting GPS location, sensor and image data -
ertgateway— a receiver application for allertnodedata
So, simply put…

ertnode
ertnode is an application that performs the actual tracking: it should be run in a device attached to the object that
needs to be tracked, e.g. a weather balloon or a vehicle. It collects telemetry data and takes photographs
(currently only with Raspberry Pi camera) and transmits them LoRa radio modulation to ertgateway receivers.
The current design consists of concurrently running threads performing data collection and data transmissions simultaneously and independently. This design allows independent configuration of data collection and transmission intervals/schedules, so that the application may store more fine-grained telemetry and image data locally than what it transmits to receivers.
There are two data collection threads in the application:
-
Telemetry data collector, which logs the collected telemetry to local disk
-
Image capture routine, which takes photographs and saves them to local disk
The respective data transmission threads are:
-
Telemetry sender, serializing the latest piece of telemetry data to MsgPack format and transmitting via radio
-
Image sender, transmitting a resized thumbnail version of the latest image captured
The transmission threads may transmit data simultaneously, so packets containing telemetry and image data will be interleaved in the radio transmissions.
In order to improve chances for successfully received telemetry data messages, there are two types of messages sent by the telemetry sender: messages with full data and description strings and messages with only the GPS data and a couple of sensor readings without string descriptions. The former amounts currently to about 1000 bytes of data, which results in 4 LoRa packets to be transmitted, and the latter, abbreviated telemetry data message is designed to fit in one 251-byte packet payload. The possibility of successfully receiving one of these one-packet messages is significantly higher than data spanning multiple packets, especially when the received radio signal is very weak.
In addition to the tracking-related functionality, ertnode runs also the same web server as ertgateway,
providing HTTP and WebSocket APIs to monitor and inspect the data it transmits in real time. The ertgateway-ui-web
web UI can be used with ertnode, although it is mainly useful for testing and debugging purposes.
ertgateway
ertgateway is responsible for receiving telemetry data messages and images transmitted by ertnode and
for providing network APIs and a user interface (with ertgateway-ui-web) to view the received data. The device
running ertgateway can be used as a fixed base station or, in the case of tracking high-altitude balloons,
as a mobile station in a chase car.
The received telemetry data messages are stored in JSON format to local log files, identically to ertnode, and
all received images are also stored on local disk. In addition to collecting telemetry data from the node,
ertgateway runs a telemetry data collector thread similar to ertnode: it logs the gateway location
(if GPS is installed), data transfer statistics and system information to separate log files. The latest telemetry data
message received from the node is also stored with each gateway log message
to make correlation easy for data analysis later.
To aid mobile use of the gateway device, most useful details of the telemetry can be displayed on
a ST7036-compatible SPI-bus-based LCD-screen. The screen driver code is mainly aimed to be used with
the Display-O-Tron HAT
where the buttons control the data displayed on the screen and the signal level is represented in the LED array.
If there is only a bare ST7036-compatible screen (without additional buttons) connected to the SPI bus, ertgateway
can be configured to cycle through all available data automatically.
Web-based user interface: ertgateway-ui-web
ertgateway-ui-web is a web-based user interfaces that provides access to the telemetry data messages and images
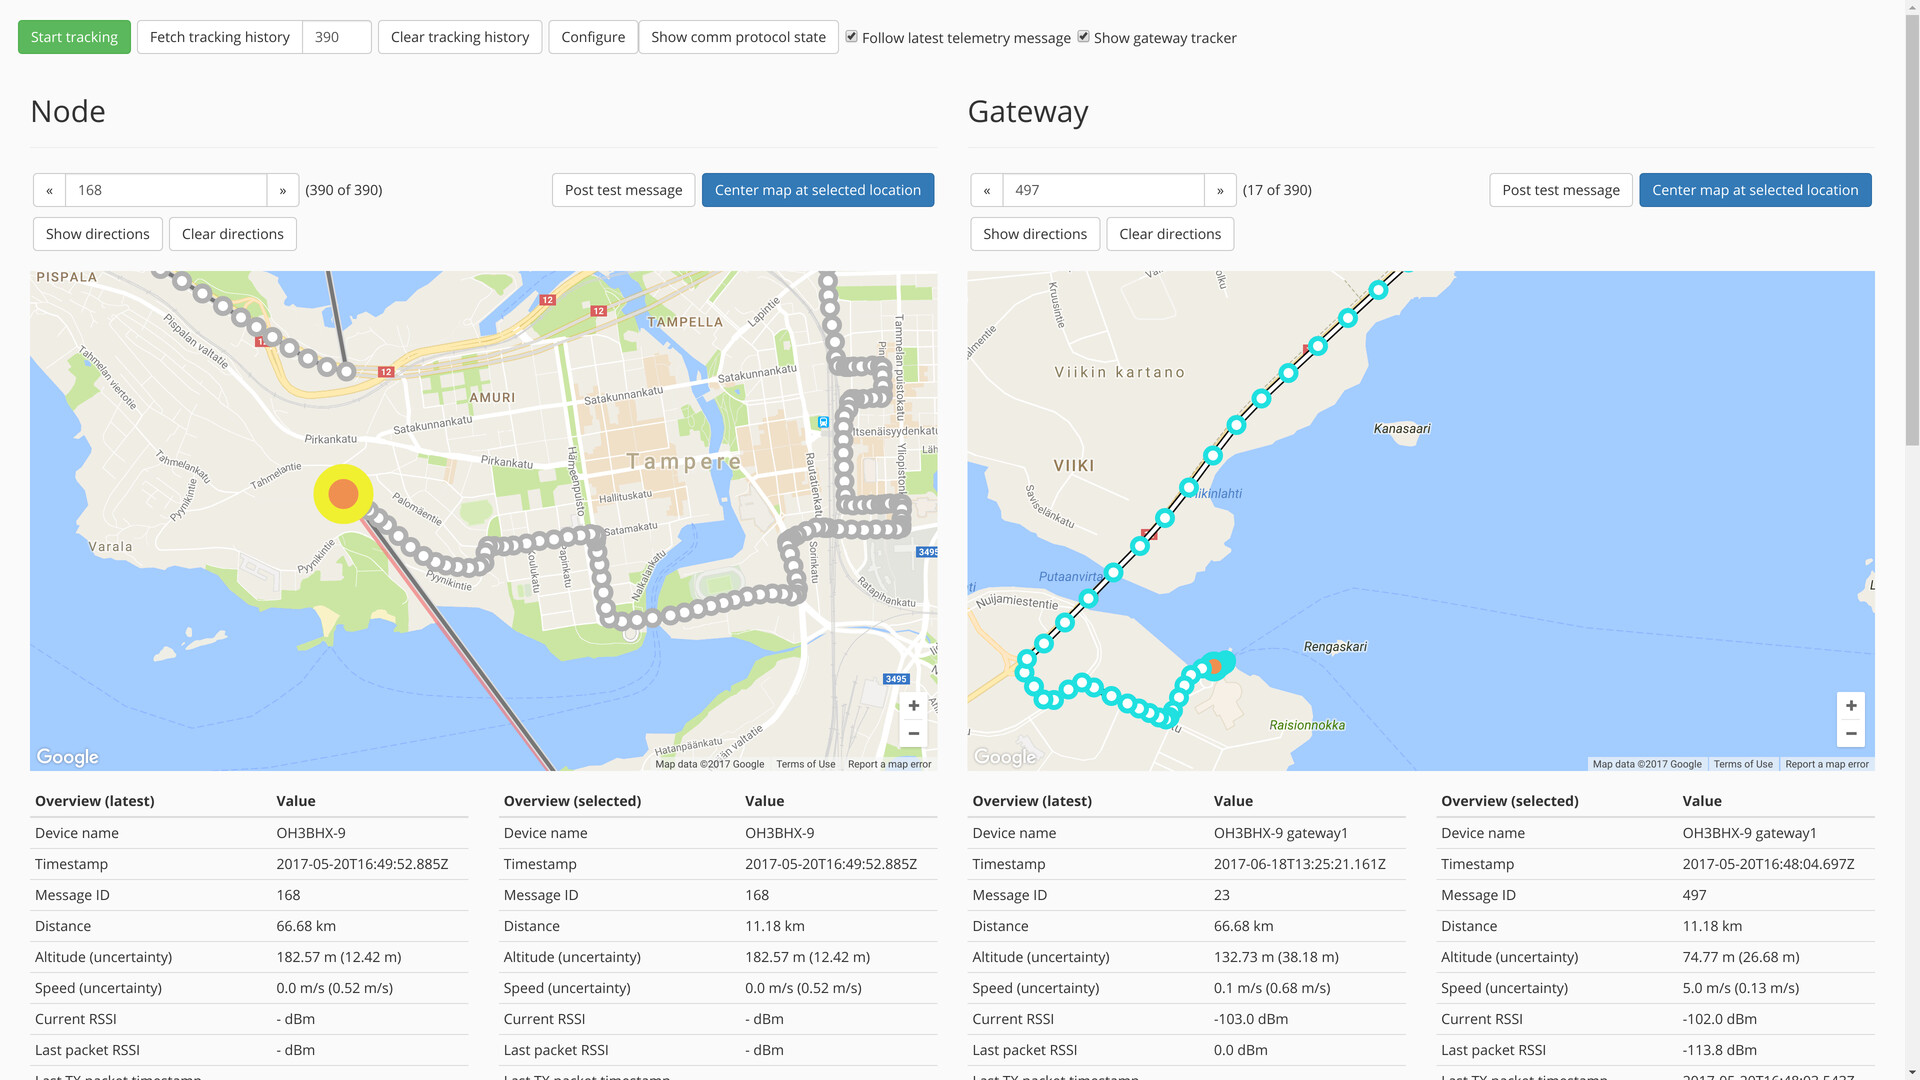
received and collected by ertgateway. It visualizes the current location and the location history of
both the node being tracked and the gateway used for tracking using embedded Google Maps widgets, and it displays
a complete breakdown of all data in a telemetry data message.
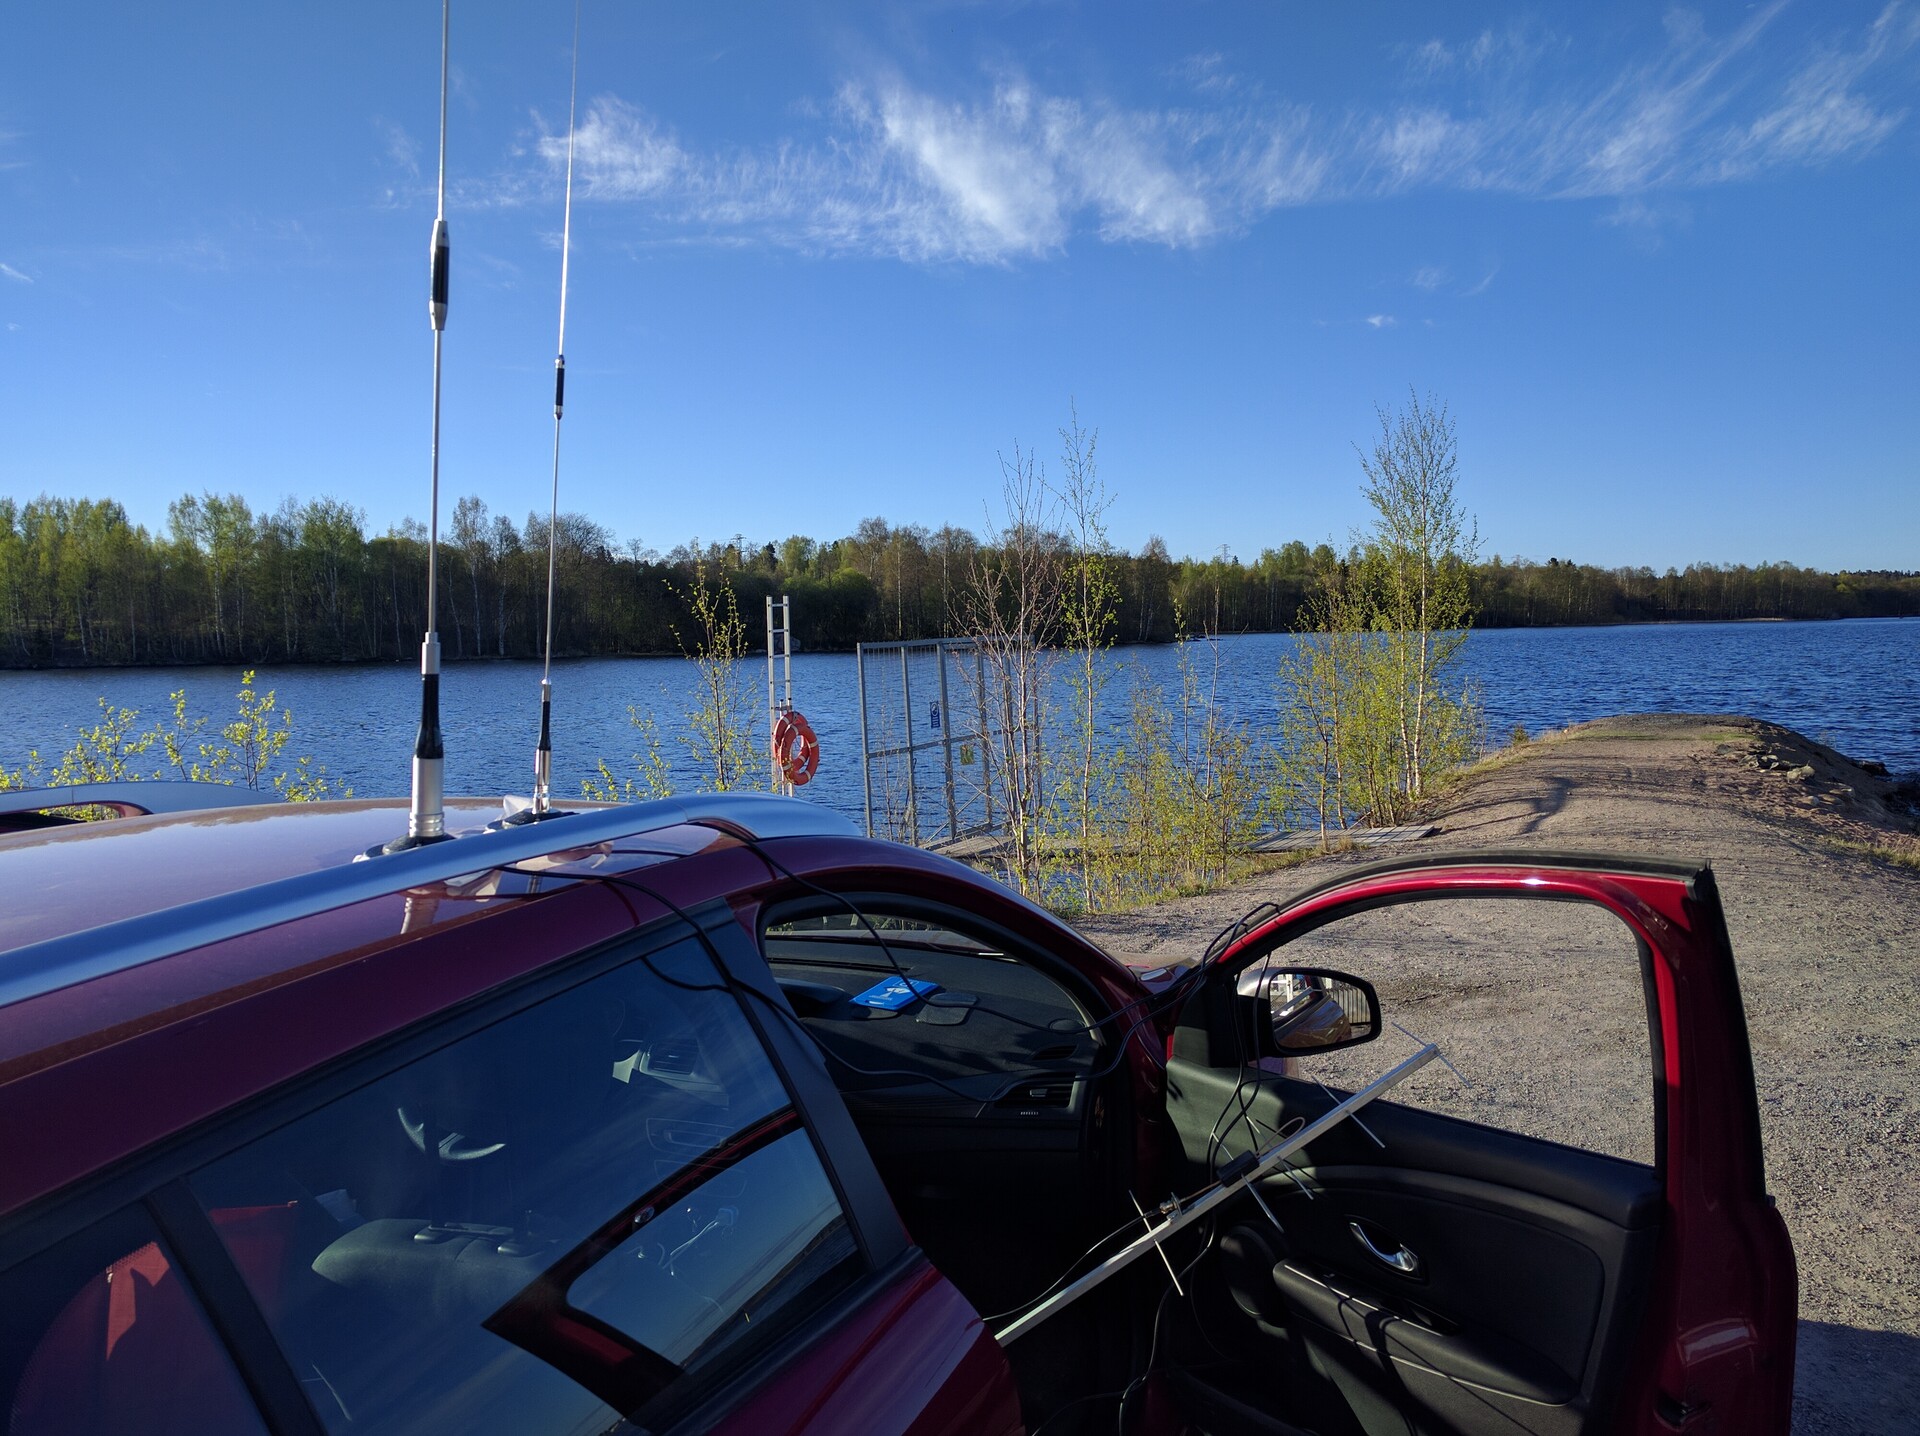
The tracking data in the screenshot above is from one of my tests for finding out maximum line-of-sight range for LoRa transmissions on the ground. In this particular test case, the node was placed in a fixed location while the gateway device was in car with me while I was driving around the city.
The UI consists of three parts, which are the global controls on the top, the node tracker view on the left, and the gateway tracker view on the right. The global controls are used to manage the tracking mode and the telemetry data message history available in the UI. In addition, the controls provide access to debugging views for displaying and changing the configuration of the gateway application and for displaying the active comm protocol streams. The tracker views on left and right should be quite self-explanatory: they display the device locations on map and the telemetry data message contents received from the node and the gateway.
The user interface source code is in another repository and it has to be built and installed separately from the rest of the application: see ertgateway-ui-web source code in GitHub.
Tracking modes
There are two ways to use the tracker UI: a live tracking mode, where the UI updates automatically by displaying the latest telemetry data message contents and images, or a manual mode, where the telemetry history and images can be downloaded by clicking the respective buttons. The modes can also be combined, as it is possible to start the live tracking mode and then download telemetry history, which is then combined with the live data received from the gateway device. This is very useful, since the live tracking mode does not display past locations or telemetry data.
The live tracking mode is enabled by clicking the green Start tracking button. Once enabled, the UI is updated
automatically with the latest telemetry data messages, map location history and images received.
The map views
The map uses circles and two types of lines for visualizing the locations of the devices: the location history is represented as circles with a white line connecting them and the direct path from the gateway to the node location is drawn as red line. The circle for the most recent location is yellow and larger than then rest of the circles, and the currently selected location is represented by a circle with orange center. Cyan circles represent the location history for the device the map is for (= node location history in the map for node) and grey circles are for the other device (= gateway location history in the map for node).
Driving directions
The Show directions button next to each map uses the Google Maps APIs to calculate and display
driving directions between the currently selected locations on the maps: the displayed route represents
directions from the gateway to the node. The total length of the route is also displayed.
Telemetry data message view
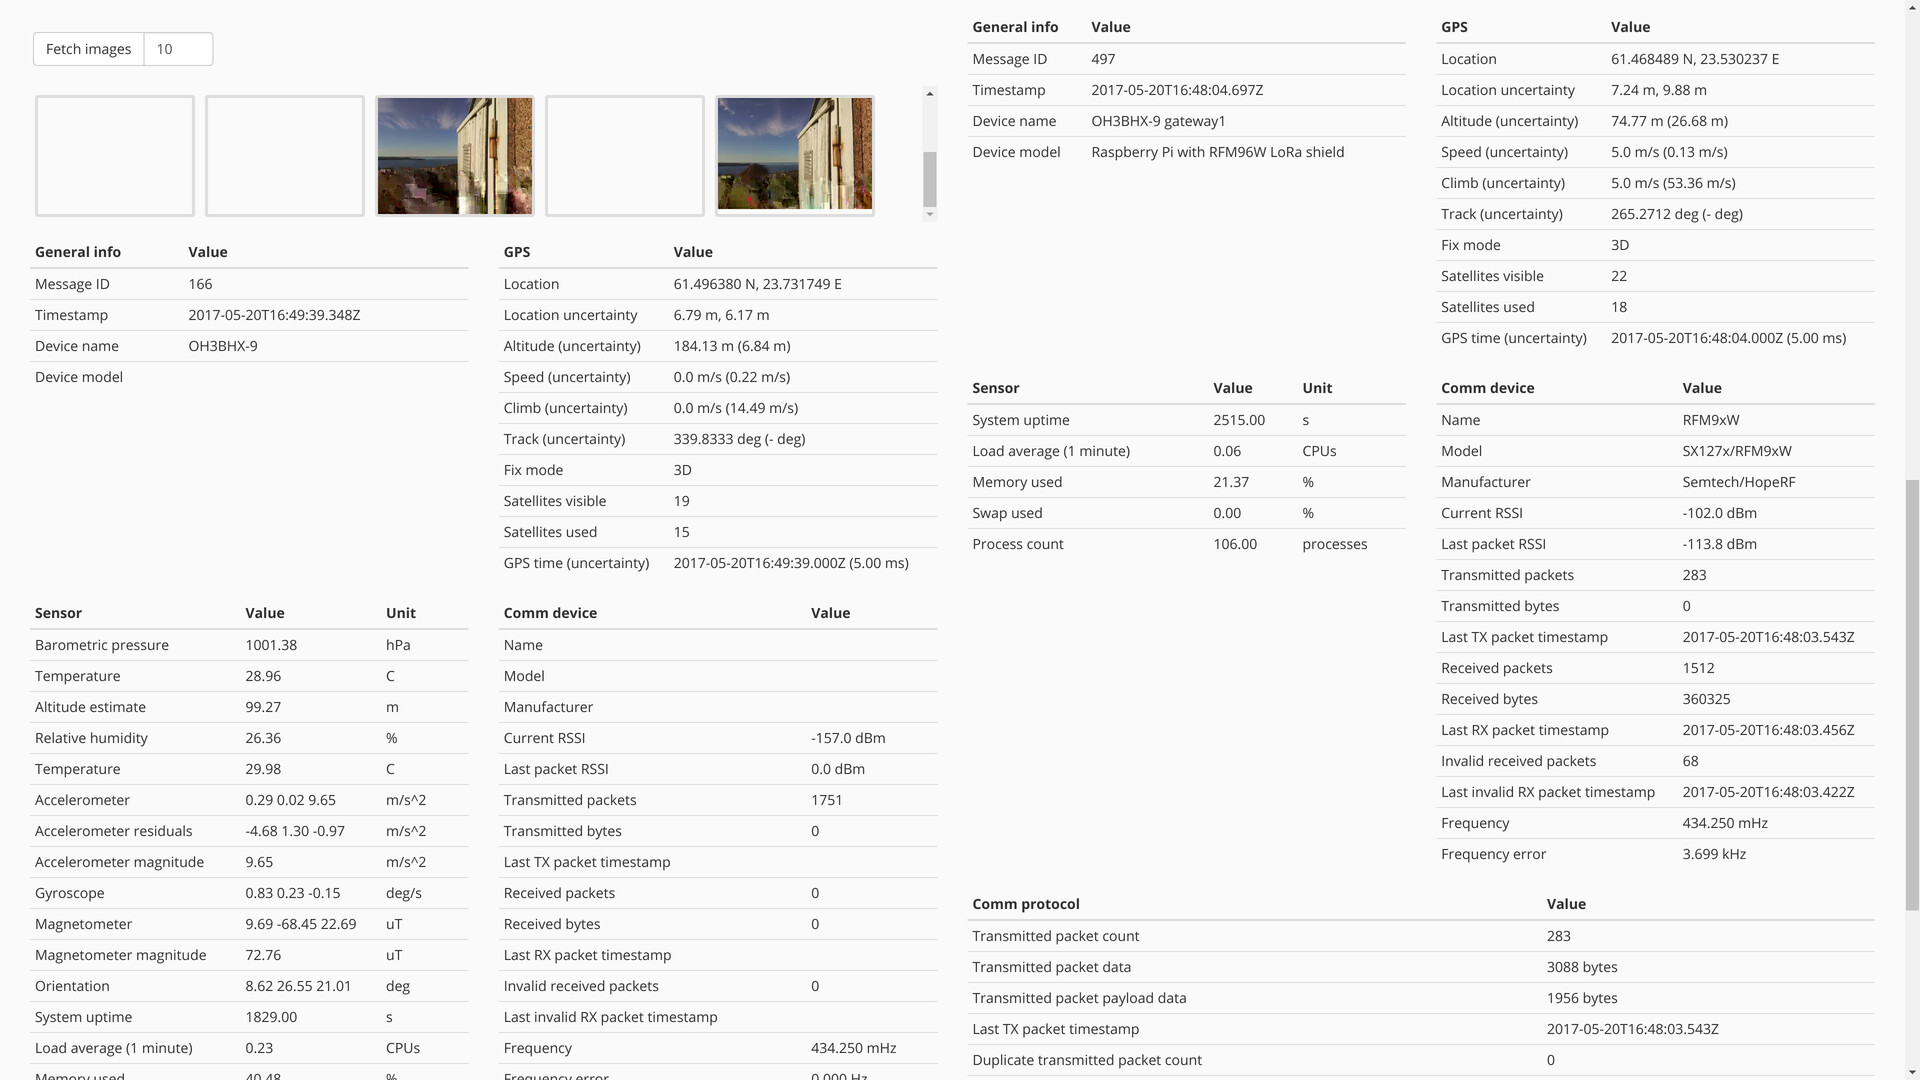
A telemetry data message view consists of six sections:
Overview
The overview section contains the most important data to track the location of the node and the connection quality. The section data is displayed both for the selected message and the latest received telemetry message, which is updated as messages are coming in.
General
The general section presents message and device identification details for the currently selected message.
Location
The location section displays raw data from GPS representing the current location and movement of the device.
Sensors
The section for sensors lists raw data from sensors, including descriptions and units for values. The descriptions are absent for abbreviated telemetry data messages, because they are omitted in the data.
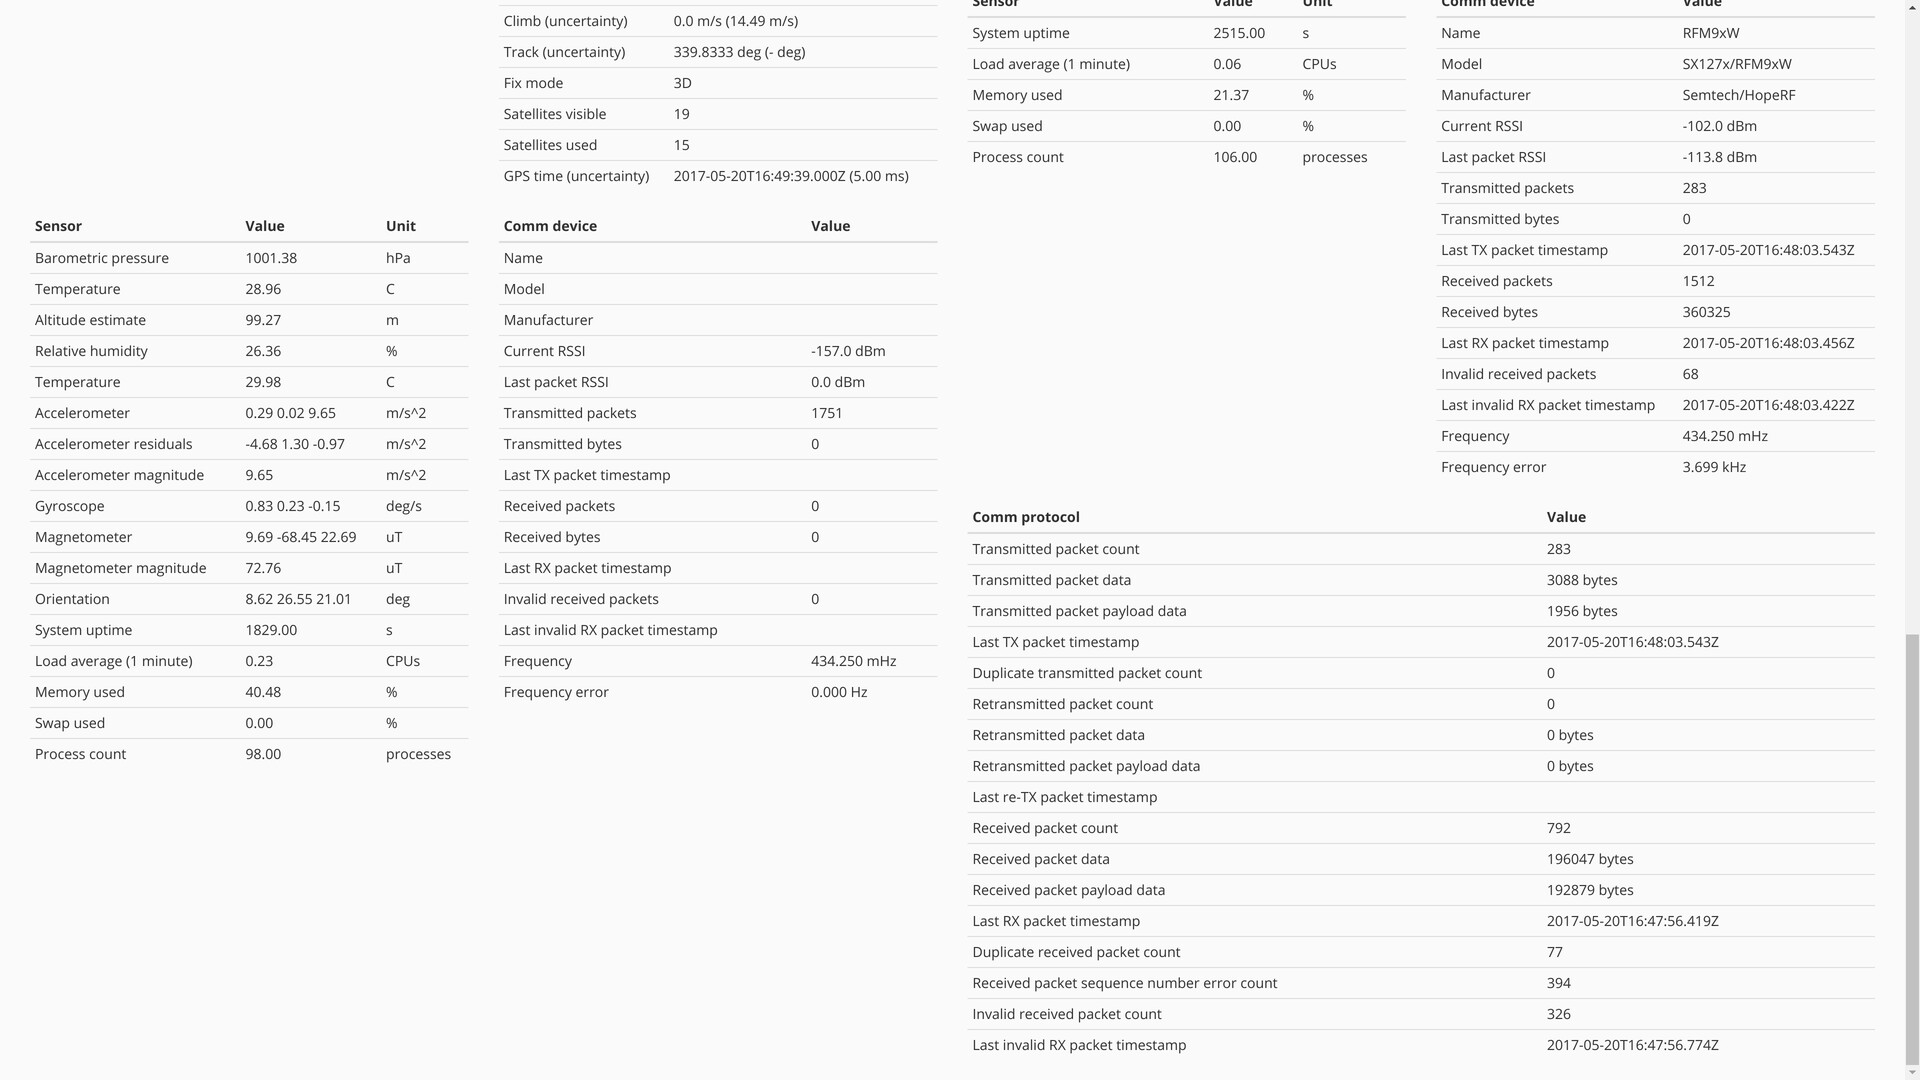
Comm device
The comm device section displays comm device data transfer statistics. The most useful values for tracking communication link quality are signal strength (RSSI), frequency error and number of invalid packets received.
Comm protocol
The comm protocol section displays comm protocol data transfer statistics. Growing numbers of retransmitted packets and packet sequence number errors indicate communication issues.
Browsing telemetry data message history
The telemetry data message history can be browsed by either clicking one of the circles on the map or by clicking the arrow buttons on both sides the text field indicating the ID of the currently selected telemetry message. Each circle indicates a recorded location of either the node or the gateway: the telemetry data message contents related to a particular location is displayed when clicking a circle.
Application internals
The project code is arranged in modules and layers, so that higher-level code uses plain C11 and POSIX APIs. There is a lightweight hardware abstraction layer (HAL) in the code: Linux- and Raspberry Pi-specific code has been extracted to separate modules.
The main applications ertnode and ertgateway have relatively small amount of code and application logic,
since they share much of their code. The shared functionality is provided by two libraries: libert and
libertapp.
libert
libert is a library containing a collection of hardware drivers, abstractions and commonly used routines needed to
develop embedded applications on Linux and Raspberry Pi (although most of the code is generic and can be used on
other hardware platforms too). It also includes some more specific functionality for ERT, such as the data logger
and sensor APIs. The library code is organized in modules that can be used as basic building blocks for
higher-level applications.
HAL
Low-level hardware access routines have been wrapped to more generic routines for accessing:
-
GPIO pins and related interrupts, based on WiringPi
-
SPI-bus, based on Linux SPI device files and
ioctlaccess -
I2C-bus, based on Linux I2C device files and
ioctlaccess -
Serial port, based on serial port device files and POSIX serial port API
Hardware drivers
The ertlib library has a collection of drivers that implement routines interacting directly with the following hardware devices:
-
Display-o-tron HAT -related drivers
-
HopeRF RFM9xW / Semtech SX127x LoRa radio module driver (SPI)
-
GSM modem driver for SMS messaging (uses AT command set via serial port)
Sensor API
The sensor API is an abstraction which supports pluggable sensor modules that supply sensor readings from one or more sensors. Each sensor is identified by a unique ID number, sensor name and manufacturer. Additionally, every sensor can provide multiple readings, or sensor values, where each sensor value is identified by sensor value ID, type ID and a textual description. The unit, such as Celsius, of the sensor value can also be specified. A sensor may output either a single or three (x, y, z) 64-bit floating-point values, depending on the sensor type.
The serialized output of sensor API data gives a good overview on the abstraction:
{
  "sensor_modules": [
    {
      "name": "RTIMULib",
      "sensors": [
        {
          "id": 1,
          "name": "LPS25H",
          "model": "LPS25H",
          "manufacturer": "",
          "available": true,
          "values": [
            {
              "type": 19,
              "label": "Barometric pressure",
              "unit": "hPa",
              "available": true,
              "value": 1014.847412109375
            },
            {
              "type": 17,
              "label": "Temperature",
              "unit": "C",
              "available": true,
              "value": 28.852083206176758
            },
            {
              "type": 22,
              "label": "Altitude estimate",
              "unit": "m",
              "available": true,
              "value": -13.288722745008519
            }
          ]
        },
        {
          "id": 2,
          "name": "HTS221",
          "model": "HTS221",
          "manufacturer": "",
          "available": true,
          "values": [
            {
              "type": 18,
              "label": "Relative humidity",
              "unit": "%",
              "available": true,
              "value": 22.480850219726562
            },
            {
              "type": 17,
              "label": "Temperature",
              "unit": "C",
              "available": true,
              "value": 29.843997955322266
            }
          ]
        },
        {
          "id": 3,
          "name": "LSM9DS1",
          "model": "LSM9DS1",
          "manufacturer": "",
          "available": true,
          "values": [
            {
              "type": 161,
              "label": "Accelerometer",
              "unit": "m/s^2",
              "available": true,
              "x": 0.44267216332405801,
              "y": -0.3302094941612333,
              "z": -9.8751781773030753
            },
            {
              "type": 164,
              "label": "Accelerometer residuals",
              "unit": "m/s^2",
              "available": true,
              "x": 1.4191916756302116,
              "y": 2.3741011214137075,
              "z": 0.46633214811384677
            },
            {
              "type": 20,
              "label": "Accelerometer magnitude",
              "unit": "m/s^2",
              "available": true,
              "value": 9.8906095551908013
            },
            {
              "type": 162,
              "label": "Gyroscope",
              "unit": "deg/s",
              "available": true,
              "x": 0.097438198038932528,
              "y": 0.074140422780019033,
              "z": -0.61695188454191696
            },
            {
              "type": 163,
              "label": "Magnetometer",
              "unit": "uT",
              "available": true,
              "x": 60.091953277587891,
              "y": -70.885871887207031,
              "z": -46.205570220947266
            },
            {
              "type": 21,
              "label": "Magnetometer magnitude",
              "unit": "uT",
              "available": true,
              "value": 103.78248596191406
            },
            {
              "type": 177,
              "label": "Orientation",
              "unit": "deg",
              "available": true,
              "x": 167.74400918493384,
              "y": -10.944455215633836,
              "z": 57.714948222446004
            }
          ]
        }
      ]
    },
    {
      "name": "sysinfo",
      "sensors": [
        {
          "id": 1,
          "name": "sysinfo",
          "model": "sysinfo()",
          "manufacturer": "Linux",
          "available": true,
          "values": [
            {
              "type": 66,
              "label": "System uptime",
              "unit": "s",
              "available": true,
              "value": 418680.0
            },
            {
              "type": 67,
              "label": "Load average (1 minute)",
              "unit": "CPUs",
              "available": true,
              "value": 0.40087890625
            },
            {
              "type": 68,
              "label": "Memory used",
              "unit": "%",
              "available": true,
              "value": 69.459439551304314
            },
            {
              "type": 69,
              "label": "Swap used",
              "unit": "%",
              "available": true,
              "value": 2.0235165436149893
            },
            {
              "type": 70,
              "label": "Process count",
              "unit": "processes",
              "available": true,
              "value": 120.0
            }
          ]
        }
      ]
    }
  ]
}
The libert code includes sensor module definitions for the following purposes:
-
rtimulib: RTIMULib module that auto-detects supported sensors-
RTIMULib supports a wide range of sensors, including temperature, air humidity, atmospheric pressure and many Inertial Measurement Unit (IMU) sensors
-
Data obtained from an IMU includes accelerometer, gyroscope and magnetometer readings
-
RTIMULib derives object orientation based on values read from an IMU
-
All Sense HAT sensors are supported by this module
-
-
sysinfo: A Linux-specific system information sensor module-
Uses
sysinfo()call to obtain system uptime, load average, memory usage, swap usage and process count
-
GPS API
The GPS API is an abstraction on retrieving GPS position data. The data model is derived from
GPSd service daemon software and there is a GPSd daemon client-based implementation
included in libert. Other types of GPS drivers can be supported too. Because of the nature of incoming GPS data
updates, where the GPS must be read actively to receive up-to-date data, the API provides a background thread
constantly reading data from the GPS module. The latest GPS data is cached, so that it can be read at any time.
An example of the serialized GPS data looks like:
{
  "gps": {
    "has_fix": true,
    "mode": "3D",
    "satellites_visible": 10,
    "satellites_used": 6,
    "skyview_time_seconds": null,
    "time": "2017-05-17T09:06:01.000Z",
    "time_seconds": 1495011961.0,
    "time_uncertainty_seconds": 0.0050000000000000001,
    "latitude_degrees": 61.0,
    "latitude_uncertainty_meters": 22.515000000000001,
    "longitude_degrees": 24.0,
    "longitude_uncertainty_meters": 11.711,
    "altitude_meters": 33.630000000000003,
    "altitude_uncertainty_meters": 137.77000000000001,
    "track": 30.994299999999999,
    "track_uncertainty_degrees": null,
    "speed_meters_per_sec": 0.35199999999999998,
    "speed_uncertainty_meters_per_sec": 1.1100000000000001,
    "climb_meters_per_sec": 0.35199999999999998,
    "climb_uncertainty_meters_per_sec": 275.54000000000002
  }
}
Data logger API
The data logger API provides tools to collect data from GPS API, sensor API and communication devices.
Data logger packages and serializes all of this data into serialized format, which is referred to as telemetry data message.
Serialization is necessary so that the data can be transmitted by the tracker (ertnode) to
the receiver (ertgateway) in a standardized format.
libert uses two data formats for telemetry data messages:
-
MsgPack for transferring data over radio connection, because MsgPack is a binary format that is very compact in order to make radio transmissions as short as possible
-
JSON for logging telemetry data messages on local disk and as response data format in the HTTP API for web browsers
Communications device API for radio devices
The communications device API is a collection of operations (functions) that need to be implemented by a device. The set of operations is largely based on HopeRF RFM9xW LoRa radio chip, which is currently the only implementation, but are generic enough to be implemented by basically any device. While the API is designed for radio communications, the abstractions makes it possible to use other types of communication media.
A driver implementing the API needs to provide callbacks (usually handled with hardware interrupts) for end of transmission and for received packets.
A comm device collects data transfer statistics, which are included in a telemetry data message:
{
  "comm_devices": [
    {
      "name": "RFM9xW",
      "model": "SX127x/RFM9xW",
      "manufacturer": "Semtech/HopeRF",
      "current_rssi": -98.0,
      "last_received_packet_rssi": -28.0,
      "transmitted_packet_count": 195,
      "transmitted_bytes": 0,
      "received_packet_count": 37,
      "received_bytes": 538,
      "invalid_received_packet_count": 0,
      "frequency": 434250000.0,
      "frequency_error": -4534.0426239999997
    }
  ]
}
Communications transceiver API
The communications transceiver API provides high-level, thread-safe access to a communications device, so that multi-threaded applications can transmit and receive data safely. The data transmission call is synchronous and blocks until a packet is transmitted (or the transmission fails). Transmitted packets are queued internally so that simultaneous transmission of packets by multiple threads will result in interleaving of the packets as each thread can only transmit and enqueue one packet at a time. The reception of a packet is signaled asynchronously by executing a callback routine.
A transceiver instance can be either in transmit or receive mode, which is controlled using a simple flag. The transceiver also controls the power-saving state of the underlying comm device, so that it is put to sleep mode when there is no activity (in transmit mode).
Communications protocol implementation
The communications protocol is an implementation of a TCP-like, reliable, stream-oriented protocol. It is built on top of the transceiver API. The comm protocol is the most complex part of the tracker and is documented in detail in comm protocol documentation in GitHub.
Also the comm protocol collects data transfer statistics, which are included in telemetry data. The statistics are included inside the JSON object containing statistics for the related comm device:
{
  "comm_devices": [
    {

      // ... comm device statistics ...

      "comm_protocol": {
        "transmitted_packet_count": 195,
        "transmitted_data_bytes": 47708,
        "transmitted_payload_data_bytes": 46928,
        "duplicate_transmitted_packet_count": 0,
        "retransmitted_packet_count": 0,
        "retransmitted_data_bytes": 0,
        "retransmitted_payload_data_bytes": 0,
        "received_packet_count": 0,
        "received_data_bytes": 0,
        "received_payload_data_bytes": 0,
        "duplicate_received_packet_count": 0,
        "received_packet_sequence_number_error_count": 0,
        "invalid_received_packet_count": 0
      }
    }
  ]
}
libertapp
libertapp implements high-level features that are specific and common to both ertnode and ertgateway.
Most of the code consists of the implementation of the HTTP and WebSocket server and related API endpoint routines,
described in HTTP and WebSocket API documentation
in GitHub.
Communication protocol
With low-power digital radio modulation technologies, such as LoRa, the packet size is usually quite small: 255 bytes in the case of LoRa. Data, including full telemetry and images, gathered by the tracker does not simply fit to a single packet, so additional coordination is needed to reliably receive the full set of data spanning multiple packets. Additionally, the type of data a packet contains must be made identifiable, since there are multiple types of data transmitted by the tracker.
In order to achieve reliable and easy-to-use radio communication between the node (transmitter) and the gateway (receiver), I have designed and implemented a TCP-like protocol, called comm protocol (what an imagination I have!), that can be used over any packet-based transmission medium. The only requirement for the protocol to work is that the system responsible for packet transfer must detect transmission errors, so that packets containing erroneously received data can be discarded.
The protocol provides:
-
Multiplexing for concurrent streams using stream IDs
-
Identification of data type with port numbers
-
Ordered transmission and reassembly of out-of-order packets using packet sequence numbers
-
Detection and retransmission of lost packets using positive acknowledgements
-
Option to automatically retransmit all data if acknowledgements are not received, increasing possibility of successful reception of data
See the detailed comm protocol documentation in GitHub.
HTTP and WebSocket API endpoints
The HTTP and WebSocket API endpoints exposed by both ertgateway and ertnode allow a user interface or
another application to monitor and download telemetry data messages and image files. ertgateway provides
all of the endpoints listed in the documentation, so that it is possible to browse telemetry data messages of the node
and the gateway separately, whereas ertnode exposes only the node-specific endpoints and allows access
to transmitted data (because ertnode functions as a transmitter).
See HTTP and WebSocket API documentation in GitHub.
Building and installing Embedded Radio Tracker
Build and installation instructions along with hardware requirements are available in README.adoc files in the GitHub repository:
Developer’s notes
I started writing the tracker software in C to make interfacing with hardware devices (e.g. SPI LoRa chip), because direct
access to low-level libraries, device files and ioctl calls is easy with C. In addition to this, using C does help
in minimizing consumption of resources, including CPU and memory usage, as there is no runtime or interpreter like
in Golang or Python, plus there is no garbage-collection to get in your way.
However, when beginning to develop this project, I never anticipated the number of features and complex logic I would end up adding to the tracker. I thought I’d just write a couple of hardware drivers and build simple applications to function as a transmitter and a receiver for LoRa packets containing only telemetry data — mission accomplished. After features — and thousands of lines of code — started to accumulate, I noticed that using C is more of a burden than something very "lightweight" or fast to develop.
The downsides with C are, of course, that the code usually becomes quite verbose, the standard library is very limited, and it’s easy to make mistakes with memory access and allocations. It’s also fairly difficult to create good abstractions and clean, encapsulated pieces of application logic with C, especially when comparing to how I’m used to writing Java or ES6. In hindsight, using a higher-level systems programming language, such as Rust, could have been a good choice. Anyway, I would not recommend writing software this complicated in plain C as there are better options available. Maybe I’ll write version 2 of the tracker in Rust, who knows? :)
Testing the tracker software and hardware
Next up, I will publish results of tests I’ve done to verify the tracker works as expected and is reliable enough to be used for tracking high-altitude balloons. The tests include measuring power consumption and battery run-time, finding maximum range for LoRa radio transmissions, and finally putting the tracker hardware in a freezer for a couple of hours.
You can follow me on Twitter at @mikaelnou where I will tweet about new blog posts when they are published.