Building Raspberry Pi HAB radio tracker software (part 1): Introduction
This is the first part of a series of blog posts that follow and document my first attempt to launch a high-altitude balloon (HAB) to perform aerial photography. The posts are focused on developing Linux-based software on Raspberry Pi for tracking high-altitude balloons.
TL;DR: If you know HAB basics, you can skip to the hardware and software sections for more details. The tracker software will be released in the coming weeks along with the next blog post for this series.
Preface
While I’m primarily a (web) software developer, I’ve been keen on tinkering with electronics and later also with embedded systems. The limiting factor in building hobby electronics projects has usually been my lack of experience and knowledge in designing and building the actual devices, so I haven’t really had much success with my projects. However, the wide adoption of Arduino, Raspberry Pi and similar platforms has changed it all during the last few years, so that hobbyists can just plug pieces of hardware together and focus on writing software — a perfect combination for me!
This post documents my findings and process of learning. I have relatively little knowledge in wireless communication and no prior experience in high-altitude ballooning, so I will begin this post by going through HAB fundamentals. I will not explain the theory of any of the topics — the post is written completely from a practical point of view.
The course of a balloon flight
A high-altitude balloon that is used to take photographs (of earth and the atmosphere) typically consists of the following parts:
-
A balloon (duh!), often made of latex, filled with helium or hydrogen
-
A parachute to ensure safe and slow landing of the payload
-
String to attach balloon to payload and the parachute to the balloon
-
Payload enclosure (with suitable insulation)
-
Payload: A tracker device
The goal is to make the balloon ascend to an altitude high enough that it will burst, as the balloon will stretch because of low atmospheric pressure. The balloon will have to be filled with a correct amount of gas to produce just the right amount of lift for the balloon, considering the weight of the balloon, the string, the parachute and the payload. The balloon may not burst at all if there is too little lift, and too much lift (with ascent rate of over 6 m/s) may damage the balloon or the payload. The duration of a flight is typically between two and three hours, which depends on many factors, including the size of the parachute and how much gas is in the balloon. There are websites with instructions and burst calculators for determining the lift and the required amount of gas.
The flight path of the balloon is generally a bit unpredictable because of winds at different altitudes, but there are tools like ASTRA High Altitude Balloon Flight Planner and CUSF Landing Predictor available to at least give an estimate on where the balloon might land. Strong winds will cause problems with balloon flights, so you should not launch a balloon if the wind speed on ground is over ~5 m/s. Weather Underground can be used to check the current conditions from local weather stations.
Tracking the balloon
A tracker device is responsible for transmitting telemetry data, including balloon location and sensor readings, so that the balloon can be tracked and the payload can be collected once it falls back on the ground. The transmissions may optionally include images or video captured by the tracker.
A typical tracker device contains:
-
A GPS receiver
-
A camera with storage for images/video
-
A radio transmitter transmitting data about balloon position, sensor readings and/or images
-
An embedded computer or a microcontroller controlling GPS, camera and radio
Currently, there is no practical way to reliably transmit large amounts of data over a long-distance radio link (using battery-powered consumer devices), so in order to get access to the full-resolution images/video recorded by the tracker, the payload must be found and recovered. The tracker isn’t necessarily a cheap device, so you probably want to find it anyway. Besides, it can be used again. One or multiple receiver devices need to be set up to receive and decode the tracker device transmissions. A receiver device can visualize the location of the balloon on a map and it may also display low-quality images sent by the tracker.
Useful resources
There is some slightly older documentation of balloon launches in Finland (where I live), mostly related to project Ilmari, but the most useful HAB resources I’ve found are the UKHAS website and Dave Akerman’s blog. There is actually an excellent blog post called High Altitude Ballooning, From The Ground Up (and back again) that summarizes almost all details and steps required to perform a successful balloon launch. The balloons and other equipment needed to physically launch a balloon have also been documented on many sites, although I will visit these topics in this blog later.
Motivation
Tracker devices have been quite primitive in the past, using microcontrollers and custom-made circuit boards, which have made the controlling software very specific to the device, not allowing the code to be reused. Additionally, the strict limitations of the hardware regarding processing power, RAM and storage have forced developers to make many compromises in the design of the controlling software. With embedded computers running an operating system like Linux, there are fewer constraints for designing the software, and the ability to use standard development tools and libraries allows the software to be reused or even repurposed more easily.
My main goal for this project is to write software for both the tracker device and the receiver, focusing on writing hardware drivers, making wireless data transmissions reliable and developing a web UI for the receiver. My plan is to develop most of the software as library routines and composable modules so that the code can be used in other contexts and applications.
Why am I working on this project? It’s fun! I also wish to learn more about wireless communication and embedded systems. And as a bonus, I may get some seriously amazing photos.
Hardware components
There are surprisingly many options available when it comes to choosing a platform for the tracker device and the required hardware add-on modules for a tracker device. The simplest and cheapest platforms may be based on Arduino or Genuino microcontroller boards, while modules like Espressif ESP8266 or ESP32 offer more processing speed and memory in addition to Wi-Fi and Bluetooth connectivity. The most powerful options are embedded, single-board computer platforms like Raspberry Pi, Beagleboard, Banana Pi and NanoPi.
It is not hard to guess that Arduino and Raspberry Pi are the most popular computer platforms for hobby electronics. I could also verify this just by browsing through the lists of hardware modules and accessories available for each type of device. Considering the goals for developing tracker software, it made most sense to choose Raspberry Pi as the tracker device platform, since it runs Linux and programming on a POSIX OS is straightforward.
Raspberry Pi, like all of the more advanced platforms, has higher power consumption than microcontroller-based boards, so it is important to choose a suitable model for the tracker to optimize battery life. According to this comparison of power consumption of Raspberry Pi models, the best choices are Model A+ and Zero, which consume as little as 80mA (0.4W) when idle. I went for Model A+, since there is a wider range of add-on boards and enclosures for it than for the newer Zero.
Radio communication background
The most important part of the tracker is the radio communication module. It needs to transmit a signal that is strong enough to be received tens or even hundreds of kilometers away. While 2G/3G networks may have the required range in low altitudes, there is no coverage in upper parts of the atmosphere. Receiving signal from such distance would most likely not be possible at all on the surface of the earth when using a relatively weak, battery-powered transmitter, because the signal is blocked by terrain and buildings. However, with balloons it is possible to achieve line-of-sight (LOS) conditions, since a balloon is up in the air and antennas can be pointed in the direction of the balloon.
Balloon telemetry is usually transmitted in unlicensed ISM or amateur radio frequency bands using radioteletype (RTTY) with simple frequency-shift keying (FSK) modulation. UKHAS have even developed a simple standard protocol for telemetry data, which can be used to send the data to Habitat server to follow the balloon position on map. As an alternative to RTTY, Automatic Packet Reporting System (APRS) has features similar to the UKHAS protocol for transmitting telemetry data, but transmitting APRS signals on the commonly used 2-meter frequency band (~144 MHz) requires an amateur radio license.
Choosing a radio module
When searching for a suitable radio module for Raspberry Pi, I came across the Pi In The Sky (PITS) project, which provides several add-on boards (HATs) for Raspberry Pi that are suitable for building a balloon tracker and a receiver device. They also provide software for the tracker and the gateway (receiver). The main PITS board contains a UBlox MAX-M8Q GPS receiver, which is supposed to be a good choice for high-altitude experiments, and a Radiometrix MTX2 transmitter for sending telemetry using RTTY. However, what is more interesting is that the PITS project also offers a more modern alternative for radio communication: a LoRa (Long-Range) Expansion Board based on HopeRF RFM95W/RFM98W LoRa chips. The chips are clones of Semtech SX127x LoRa modules so they can be used interchangeably.
LoRa(tm) is an emerging modulation intended to be used in IoT applications. The modulation offers good immunity to radio interference (see comparison to FSK) and, as the name suggests, very long range of optimally tens of kilometers for transmissions. The chips have a high-level SPI interface, they are highly configurable, relatively easy to program and they can be used for both transmission and reception. The only downside is probably the fact that LoRa is a proprietary modulation, so it cannot be reliably received with ordinary radio equipment. However, that is most likely going to change, since the modulation has been almost completely reverse-engineered and there are proof-of-concept implementations along with research documentation available for receiving LoRa transmissions using ordinary SDR dongles.
It seems that GitHub user rpp0’s LoRa implementation is being actively developed and it supports most of the configuration options for the modulation and it provides tools for real-time demodulation and decoding of LoRa signals. Out of curiosity, I briefly tested reception of LoRa packets with rpp0’s gr-lora on my simple RTL-SDR USB-dongle setup and while I was able to successfully receive some data, larger packets were corrupted and some packets were completely lost. Nevertheless, it was a promising result and it will be soon possible to receive LoRa transmissions without specialized LoRa chips.
For the tracker device, I chose to use the LoRa board for radio communication and get the UBlox MAX-M8Q on a separate board, since I thought I would not be using RTTY transmissions for anything.
Choosing sensors
To make the tracker more interesting and useful, I wanted to include more sensors in it (in addition to the plain GPS) so that it can collect and transmit this data during the flight. My original idea was to add a sensor for measuring temperature and barometric pressure, such as the BME280, but I found that the Sense HAT for Raspberry Pi actually offers that in addition to gyroscope, accelerometer, magnetometer and air humidity, and there is driver software available for all of the sensors.
Buying the components
Before buying any of the add-on boards, or HATs, it is useful to check that there are no conflicts with Raspberry Pi peripheral buses and the boards. The I2C bus can be shared between devices as long as each device has a unique address. The SPI bus can also be shared, but it requires a separate chip enable pin for each device to enable one device at a time and keep others disabled while transferring data. The serial port can naturally be used by one device only.
All of the Sense HAT sensors (along with the unused LED matrix and joystick) use I2C interface, the GPS board sends data through serial port (UART) and the LoRa board is controlled via SPI, so the boards should work together as expected.
Raspberry Pis and its accessories are sold by many online stores (even in Finland), but I found the cheapest prices and widest collections of add-ons and accessories from UK (where Raspberry Pi originates from):
Building the tracker device
The tracker device is made of the following parts:
-
Raspberry Pi GPS HAT from ModMyPi (although it is made by Uputronics)
-
Raspberry Pi+ LoRa™ Expansion Board from Uputronics
-
Choose the frequency allowed in your country, one chip in the board is enough
-
-
434/868Mhz "Stubby" Antenna from Uputronics
-
Choose according to the frequency of the LoRa chip
-
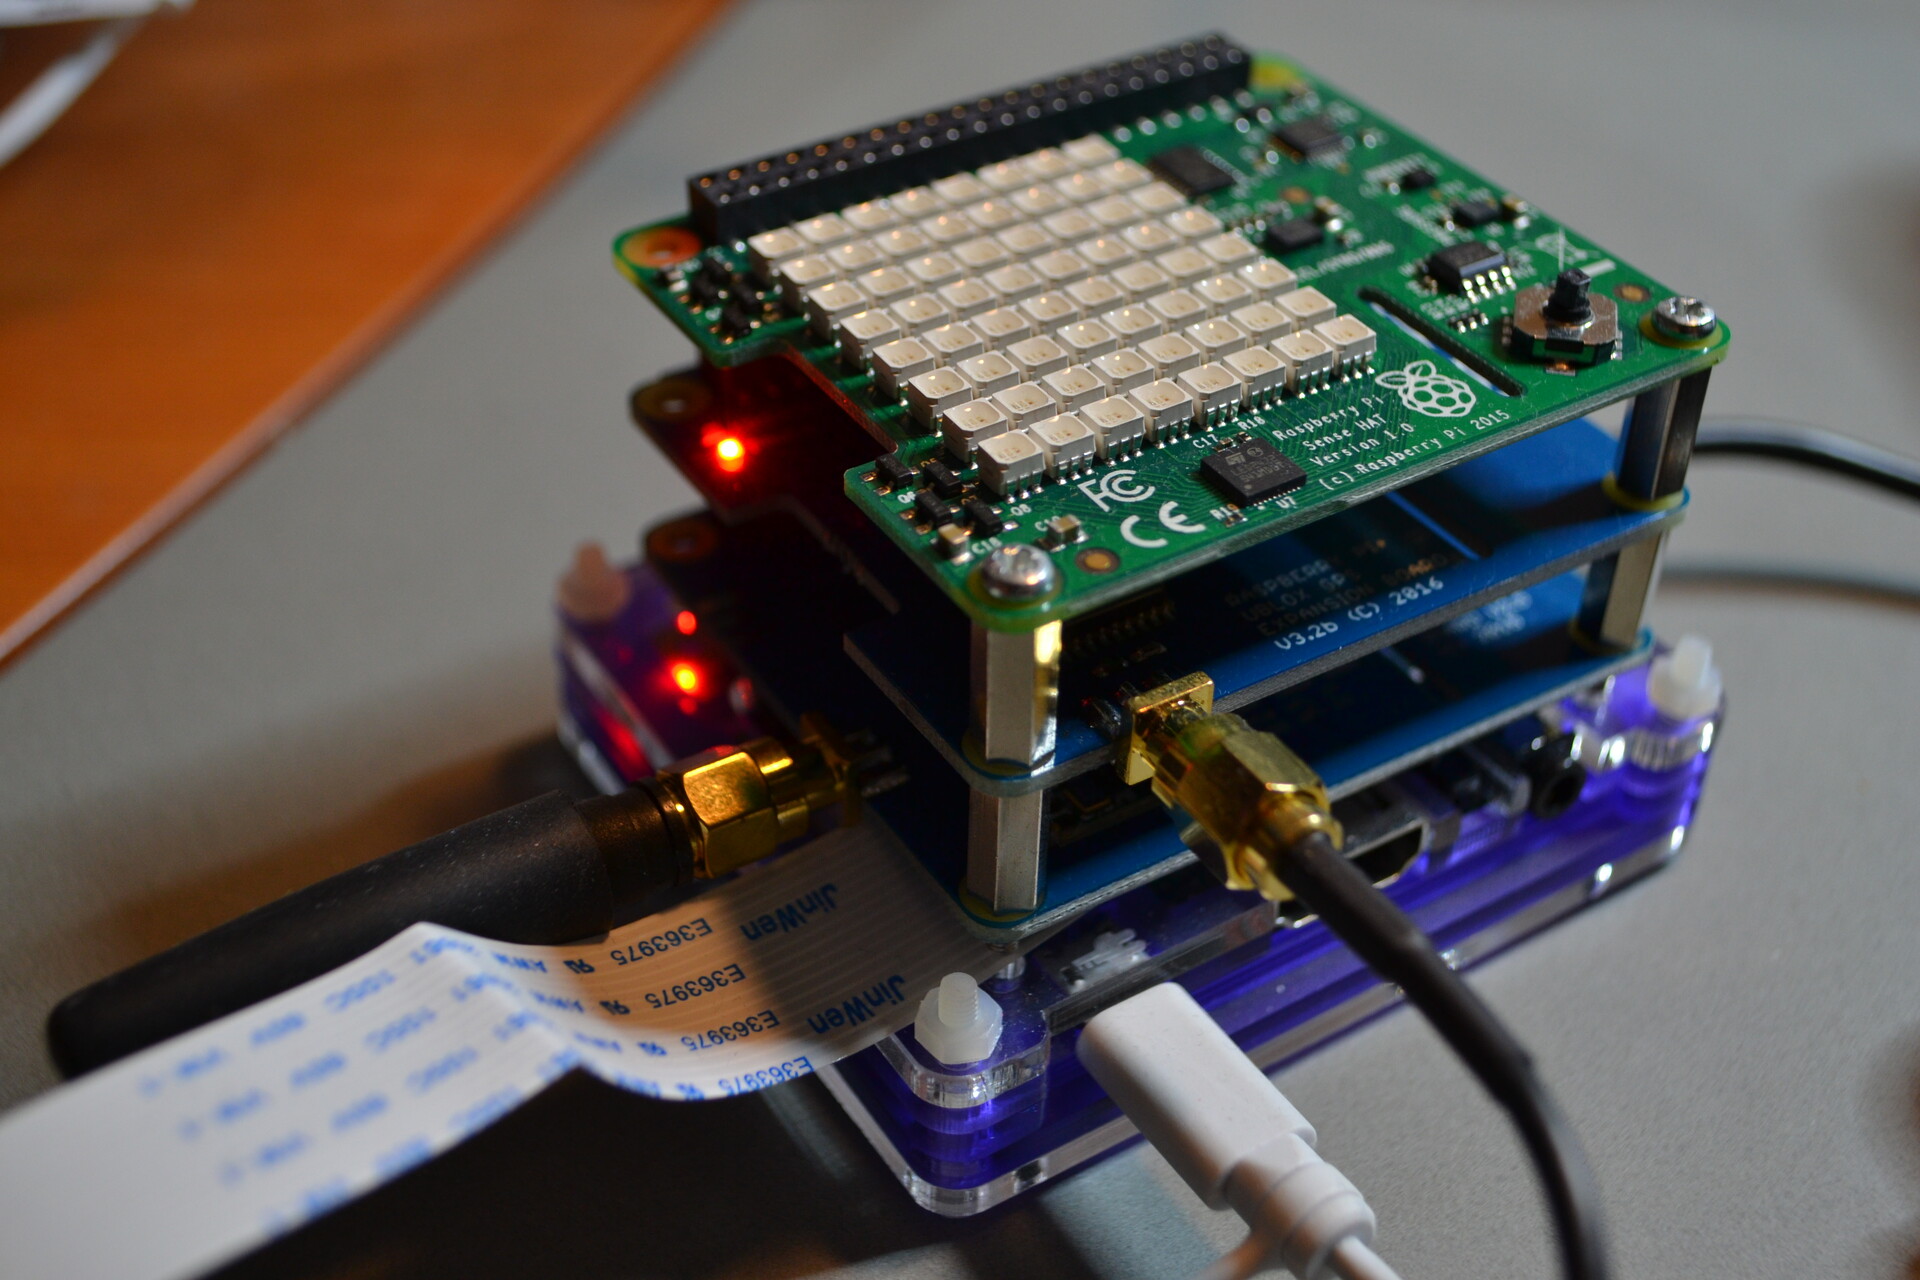
As can be seen in the photo, it is very easy to stack Raspberry Pi HATs (Hardware Attached on Top) when there are no I/O conflicts. The boards are (from top to bottom): Sense HAT, GPS HAT (with external antenna, not visible in the photo) and LoRa Expansion Board (with the "stubby" antenna). The HATs have holes for the wide camera cable, but with three HATs stacked, it was easier to just bend it sideways.
Building the receiver device
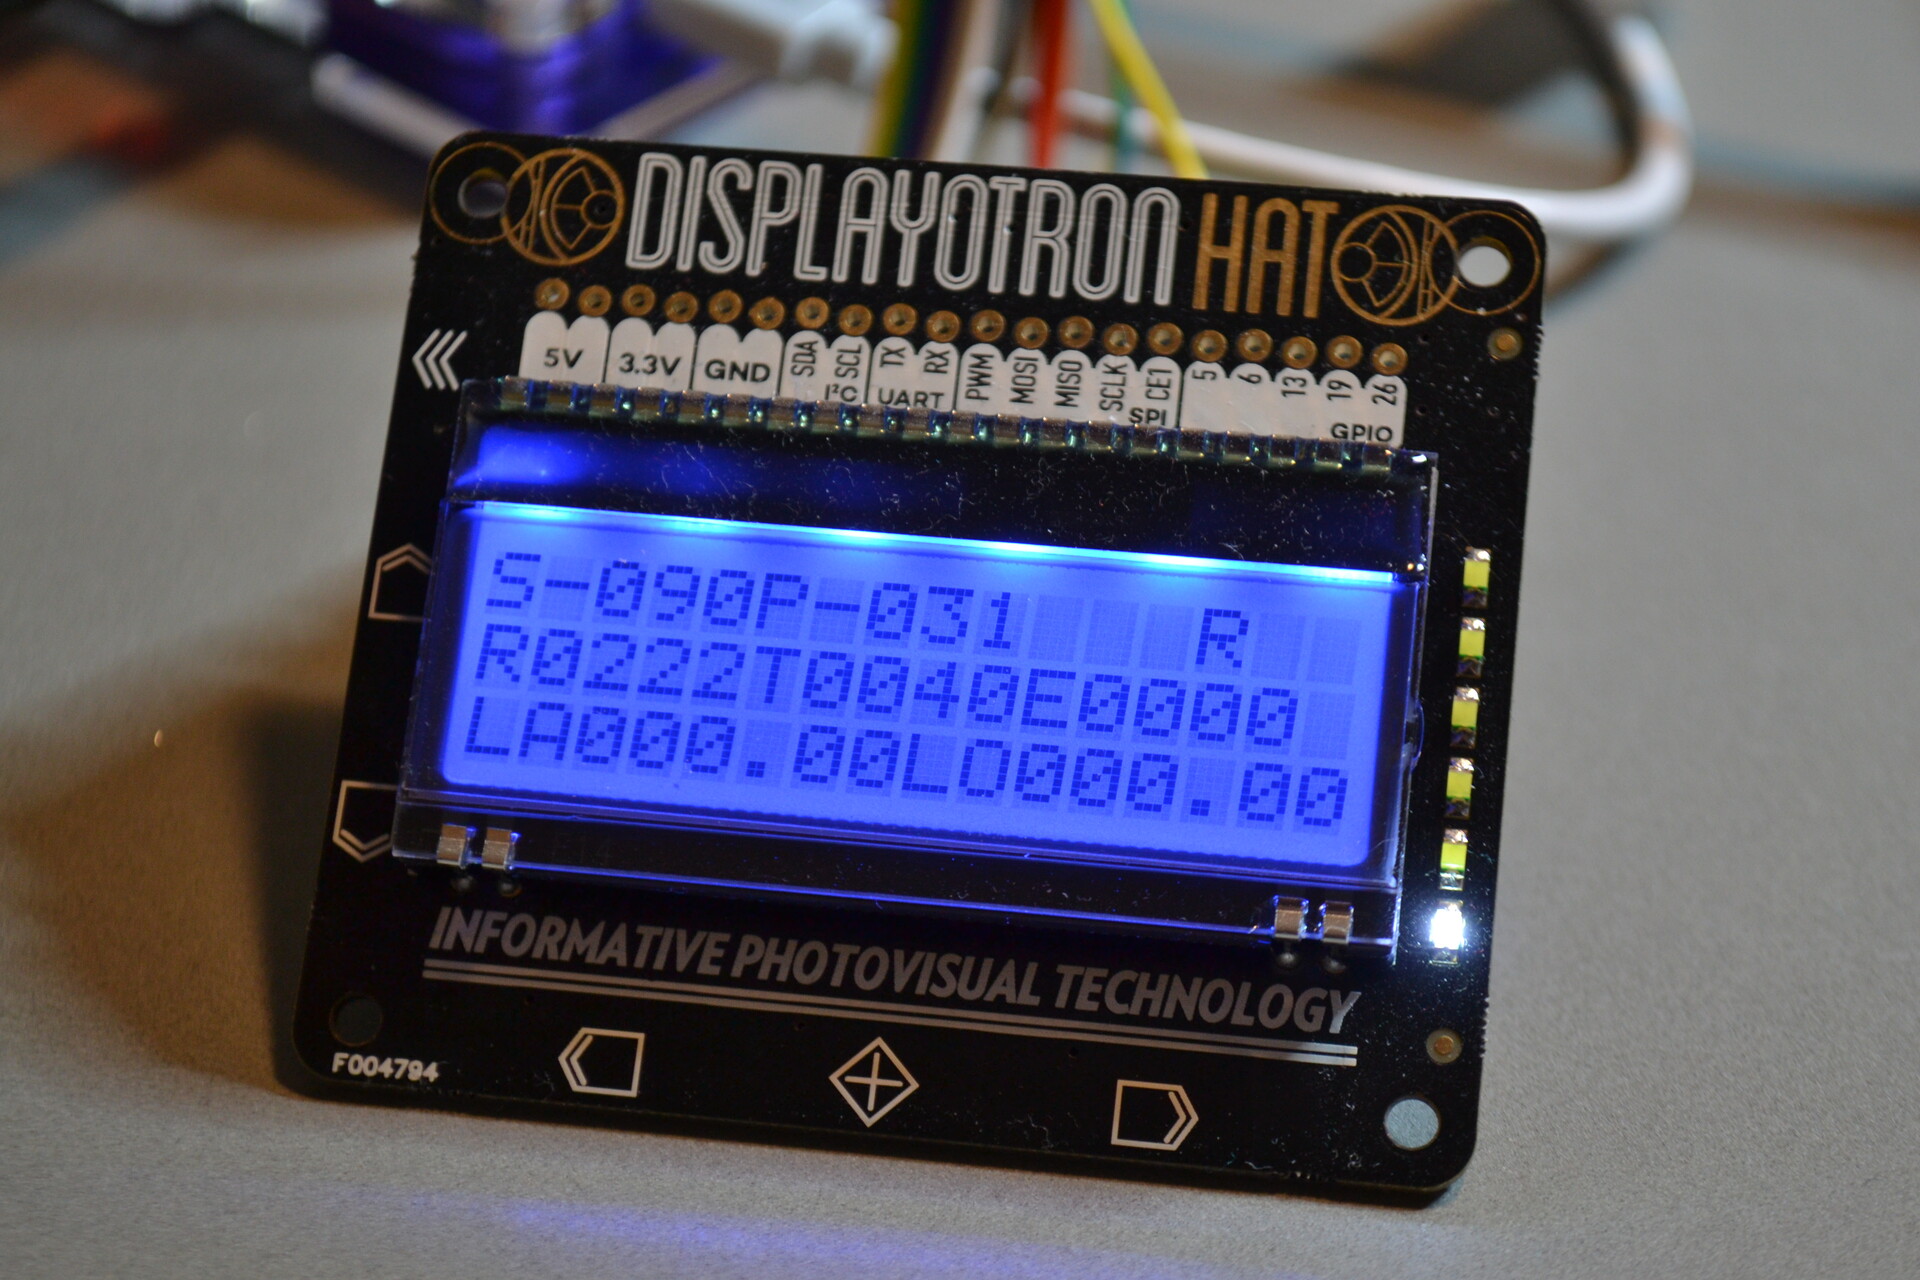
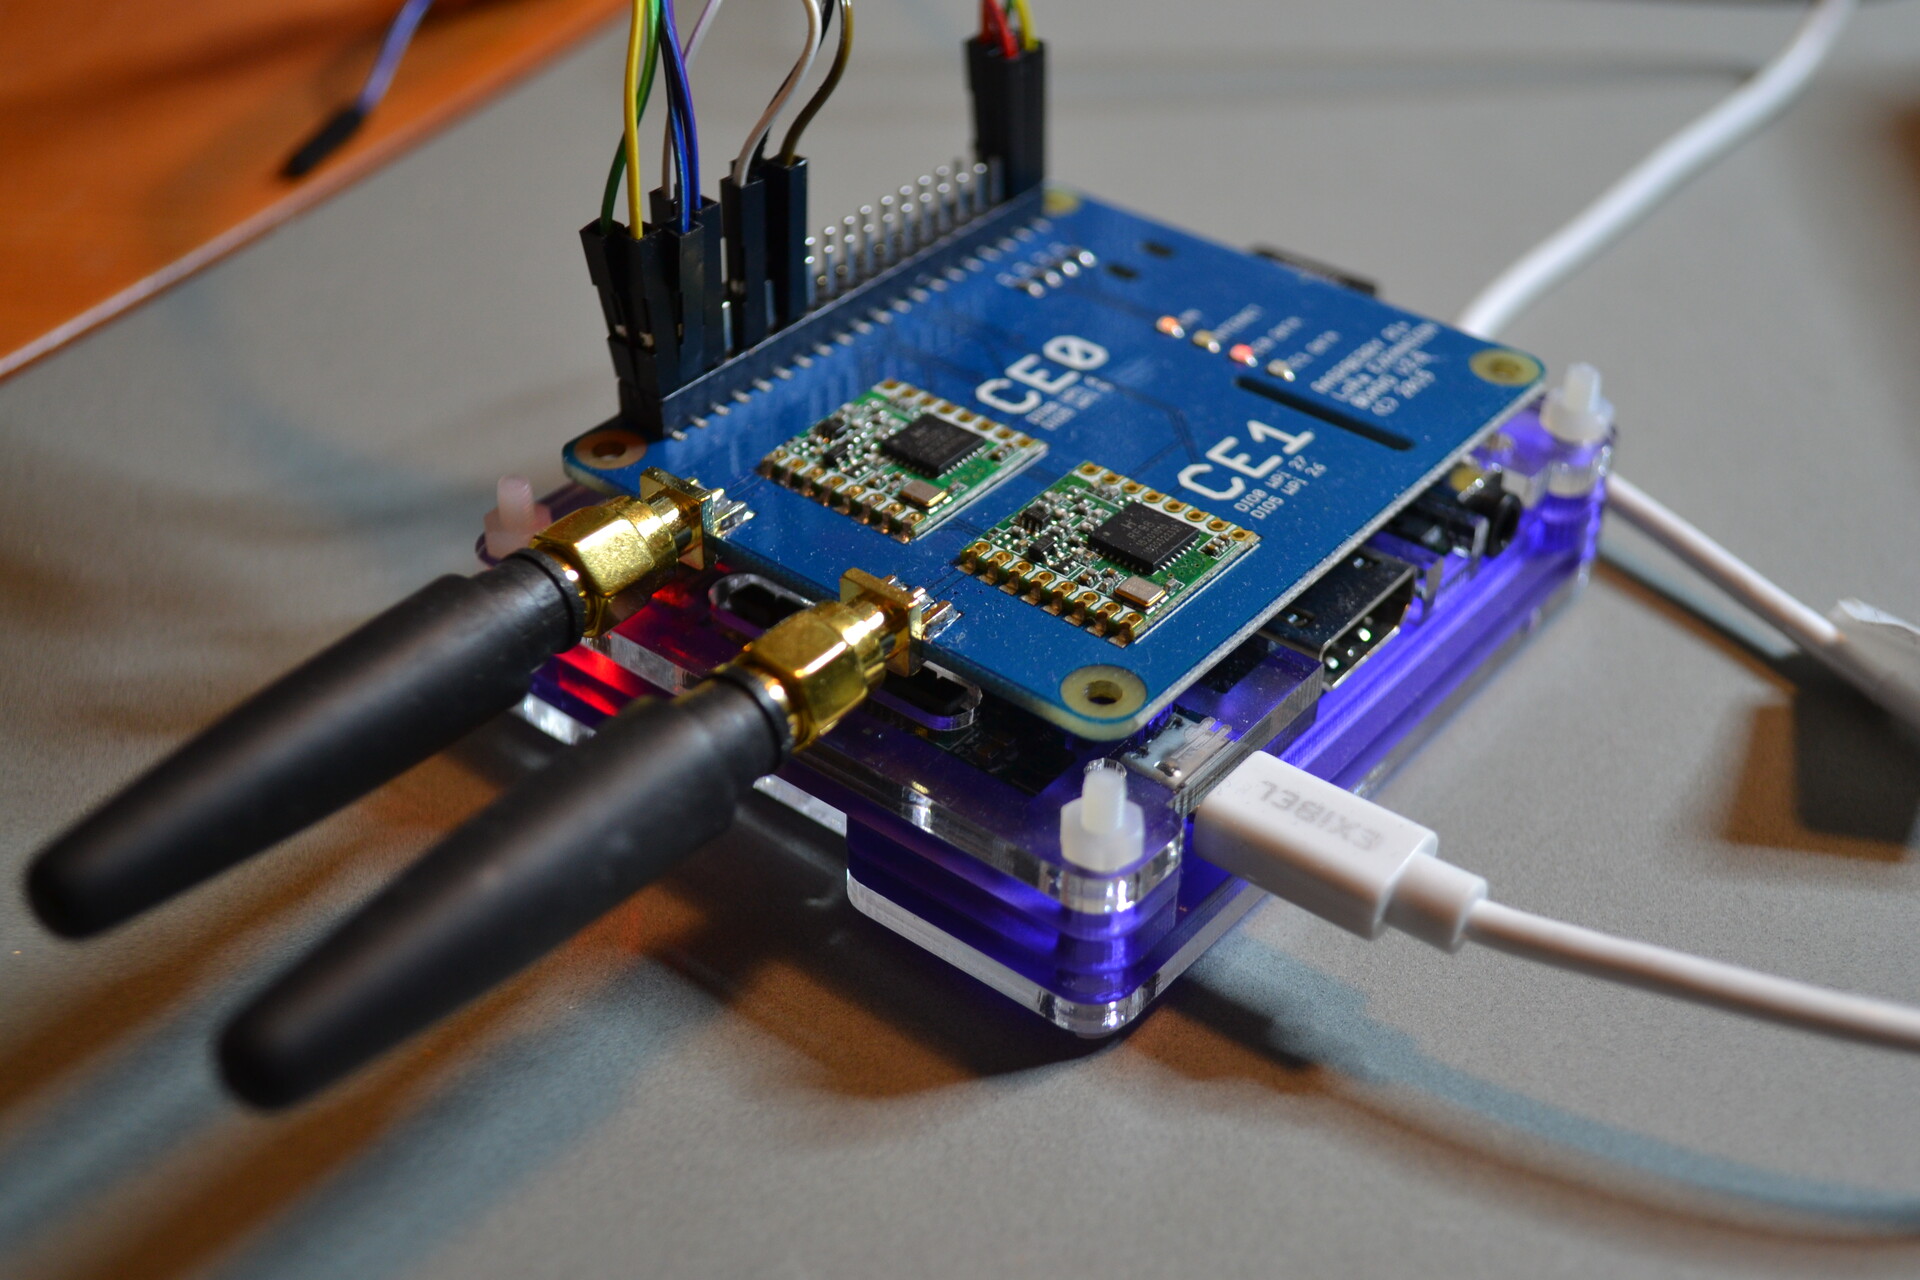
The receiver device could basically be any computer with equipment and software capable of receiving and decoding the transmissions of the tracker device. In the case of LoRa transmissions, however, I had to use a Raspberry Pi also as the receiver device so that I could use the same LoRa add-on board for reception, because LoRa reception is not yet reliable without proprietary LoRa hardware. The LoRa board has SMA antenna connectors so a more powerful external antenna can be connected to the device to improve reception. To make the receiver device a bit more fun to use, I added a Display-o-Tron HAT LCD display module with some extra LEDs and buttons to show real-time information about signal strength and telemetry data.
The receiver device has the following parts:
-
Raspberry Pi+ LoRa™ Expansion Board from Uputronics
-
Choose the frequency allowed in your country, one chip in the board is enough
-
-
434/868Mhz "Stubby" Antenna from Uputronics
-
Choose according to the frequency of the LoRa chip
-
The information displayed on the screen in the photo is just one of my early tests with the gateway, but it includes already the signal strength (RSSI) both as numbers and using the LED bar graph, and some counters for transferred LoRa packets.
The Display-o-Tron HAT is connected with a custom pinout via wires, because I was not careful enough when checking for
conflicts between the boards. Both the LoRa chips and the LCD screen are controlled via SPI bus and having two LoRa
chips (for possibility of simultaneous transmit and reception) in the LoRa Expansion Board creates a conflict with
the SPI pins used by the display, because the chip in slot named CE0 uses the Chip Enable 0 pin for SPI0 bus.
Fortunately, Raspberry Pi has multiple SPI buses, which can be enabled using the built-in device tree overlays of Raspbian.
The configuration change is simple: just add dtoverlay=spi1-1cs to /boot/config.txt on the Raspbian SD card, reboot
and another SPI device /dev/spidev1.0 appears. Then the
SPI-related pins of DoT HAT
need to be connected to SPI1 interface pins of Raspberry Pi instead of the usual SPI0.
Software
Designing and writing the software for the tracker, called node in this project, and the receiver, called gateway, is my main focus for this project. There is existing software available for balloon trackers, including the PITS project, but as a software developer I wanted to write my own software as a tool for learning about low-level control of peripherals and radio communication.
The software consists of three parts: common routines (library), including the wireless communication protocol implementation and drivers for peripherals, node (tracker) application and gateway (receiver) application. I will now go through a high-level overview of the software. I will describe the features of the applications and document the technical solutions (like the communication protocol packet format and data transmission logic) in more detail in the next blog post, once I have finalized to code for an initial release.
Wireless communication protocol
The most important responsibility of the tracker software is to transmit telemetry data reliably to the receiver(s). Since wireless communication is inherently unreliable and prone to transmission errors, I decided to implement a protocol that provides more reliable data transmission. The LoRa radio chip supports packet-based data transfer with a maximum packet size of 255 bytes and bit-level error correction, but it does not offer a way to recover a packet that has not been received correctly or that has not been received at all. It’s like working with IP packets over an unreliable transport medium, except that there is no addressing, so designing a protocol that has features similar to TCP made sense for this purpose.
The protocol I have designed provides:
-
Multiplexing for concurrent streams using stream IDs (numbers)
-
Identification of data application/purpose with port numbers
-
Ordered transmission with packet sequence numbers
-
Detection and retransmission of lost packets using positive acknowledgements
I left out source and destination addresses on purpose, since I’m dealing with one device at a time and it’s possible to use different transmission frequency for each device if multiple devices are in use, but it should be fairly easy to implement addressing in the protocol.
Node application
The node application runs two routines, which both are responsible for collecting and transmitting data.
Telemetry routine
The telemetry routine:
-
Collects telemetry data periodically
-
GPS data
-
Sense HAT sensors
-
System info
-
Radio transmission stats
-
-
Stores collected data to local disk in JSON format
-
Transmits abbreviated version of the telemetry data in MsgPack format using LoRa radio
It is essential to transmit as few bytes over radio as possible, so that chances of encountering transmission errors are minimized. I chose to use a data format that is extensible, meaning that more data and sensor readings can be added to it later, which makes the format already a compromise, since each data field needs a name or an identifier in the data format. JSON fits the purpose well when storing the data to local disk. However, JSON is a very verbose format and it practically wastes space, so the application uses MsgPack for transmitting telemetry data over radio. MsgPack is basically a binary representation of JSON with the goal of optimizing space used by the data format. In addition to using MsgPack, only the most important parts of the telemetry data are transmitted over radio.
Image capture routine
The image capture routine:
-
Captures images periodically using Raspberry Pi camera (although other sources could be used easily)
-
Stores full-size images to local disk in JPEG format
-
Transmits thumbnail images in WEBP format using LoRa radio
WEBP image format provides image quality similar to JPEG with less bytes. I was able to encode WEBP images that are around 40-50% smaller than JPEG images with less visible artifacts from compression.
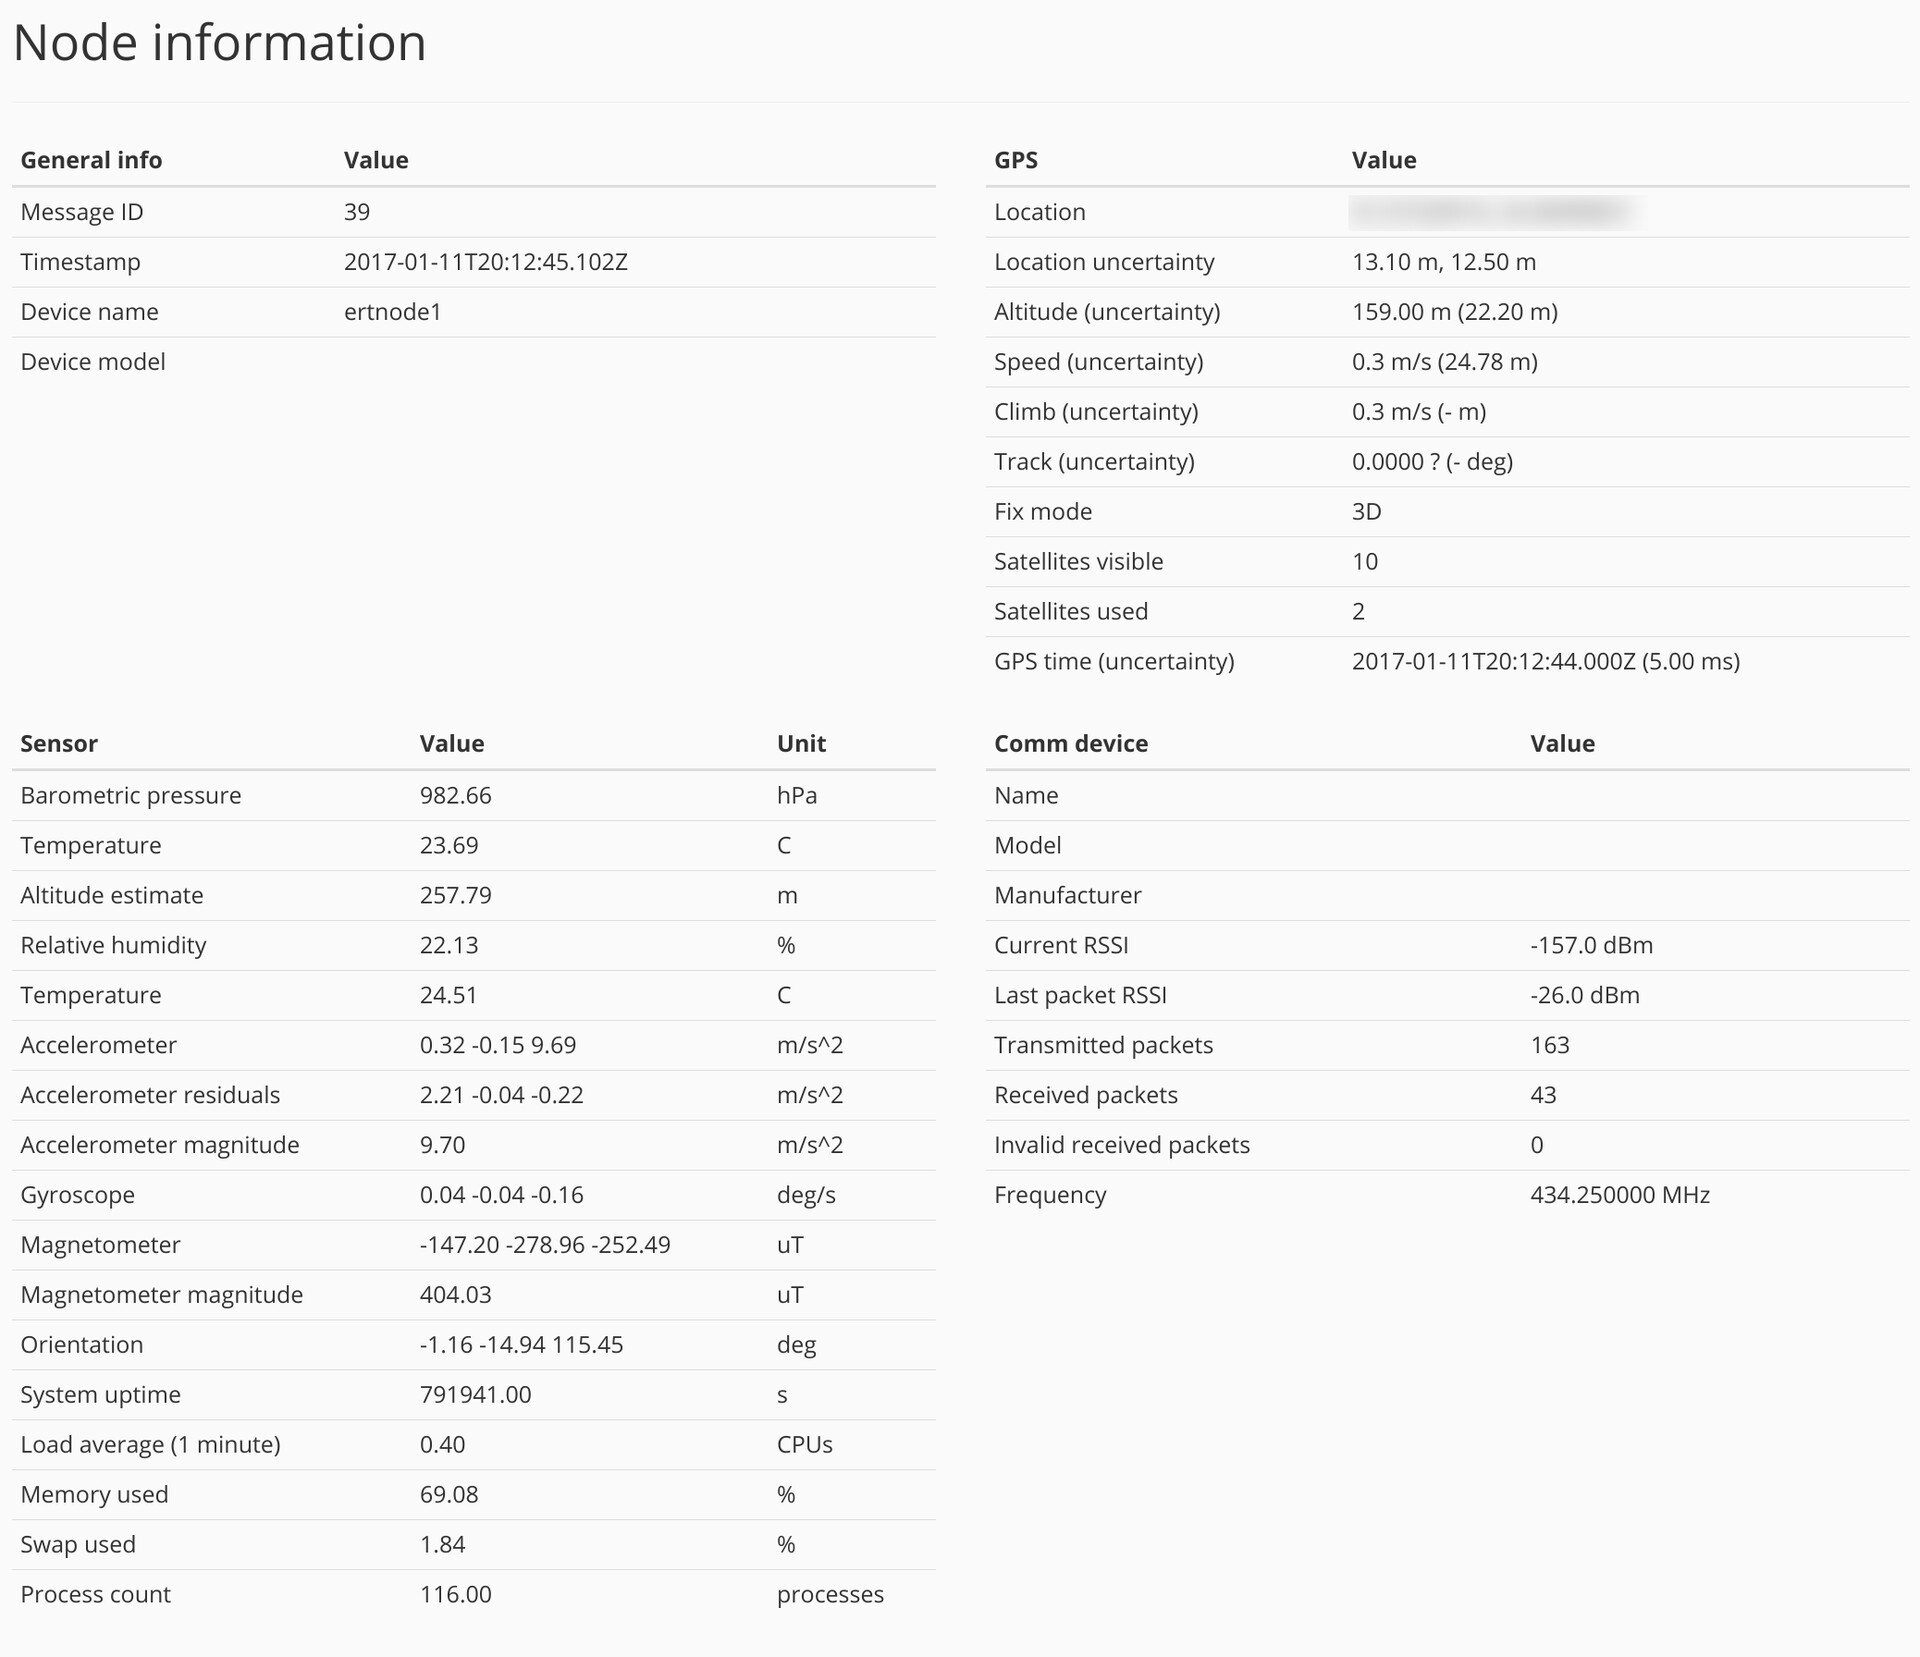
Telemetry log data format
The telemetry log data format contains detailed GPS data, sensor data and statistics about (radio) communication devices. The sensor data fields are fixed with support for both single-value and 3D-sensors so that it is very easy to parse the data. The fields are mostly self-explanatory.
Here is an example of a single JSON telemetry data entry logged by the node application:
{
  "id": 57,
  "type": 1,
  "timestamp": "2017-01-11T20:14:58.364Z",
  "device_name": "ertnode1",
  "device_model": "RPi",
  "gps": {
    "has_fix": true,
    "mode": "3D",
    "satellites_visible": 10,
    "satellites_used": 2,
    "time": "2017-01-11T20:14:57.000Z",
    "time_seconds": 1484165697.0,
    "time_uncertainty_seconds": 0.0050000000000000001,
    "latitude_degrees": 61.000000000000000,
    "latitude_uncertainty_meters": 6.4000000000000004,
    "longitude_degrees": 24.000000000000000,
    "longitude_uncertainty_meters": 9.3000000000000007,
    "altitude_meters": 134.90000000000001,
    "altitude_uncertainty_meters": 19.100000000000001,
    "track": 0.0,
    "speed_meters_per_sec": 0.19400000000000001,
    "speed_uncertainty_meters_per_sec": 20.879999999999999,
    "climb_meters_per_sec": 0.19400000000000001
  },
  "comm_devices": [
    {
      "name": "RFM9xW",
      "model": "SX127x/RFM9xW",
      "manufacturer": "Semtech/HopeRF",
      "current_rssi": -89.0,
      "last_packet_rssi": -26.0,
      "transmitted_packet_count": 245,
      "received_packet_count": 60,
      "invalid_received_packet_count": 0,
      "frequency": 434.25
    }
  ],
  "sensor_modules": [
    {
      "name": "RTIMULib",
      "sensors": [
        {
          "id": 1,
          "name": "LPS25H",
          "model": "LPS25H",
          "manufacturer": "",
          "available": true,
          "values": [
            {
              "type": 19,
              "label": "Barometric pressure",
              "unit": "hPa",
              "available": true,
              "value": 982.6142578125
            },
            {
              "type": 17,
              "label": "Temperature",
              "unit": "C",
              "available": true,
              "value": 23.745832443237305
            },
            {
              "type": 22,
              "label": "Altitude estimate",
              "unit": "m",
              "available": true,
              "value": 258.19843065390307
            }
          ]
        },
        {
          "id": 2,
          "name": "HTS221",
          "model": "HTS221",
          "manufacturer": "",
          "available": true,
          "values": [
            {
              "type": 18,
              "label": "Relative humidity",
              "unit": "%",
              "available": true,
              "value": 22.310836791992188
            },
            {
              "type": 17,
              "label": "Temperature",
              "unit": "C",
              "available": true,
              "value": 24.621700286865234
            }
          ]
        },
        {
          "id": 3,
          "name": "LSM9DS1",
          "model": "LSM9DS1",
          "manufacturer": "",
          "available": true,
          "values": [
            {
              "type": 161,
              "label": "Accelerometer",
              "unit": "m/s^2",
              "available": true,
              "x": 0.31824539052527395,
              "y": -0.15074782089083455,
              "z": 9.7005025783985843
            },
            {
              "type": 164,
              "label": "Accelerometer residuals",
              "unit": "m/s^2",
              "available": true,
              "x": 2.219470093280822,
              "y": -0.029611522738495839,
              "z": -0.2296077970534563
            },
            {
              "type": 20,
              "label": "Accelerometer magnitude",
              "unit": "m/s^2",
              "available": true,
              "value": 9.7068919871747497
            },
            {
              "type": 162,
              "label": "Gyroscope",
              "unit": "deg/s",
              "available": true,
              "x": -0.11890969810766097,
              "y": -0.097545133188125535,
              "z": 0.0088252447378911626
            },
            {
              "type": 163,
              "label": "Magnetometer",
              "unit": "uT",
              "available": true,
              "x": -147.20269775390625,
              "y": -279.22787475585938,
              "z": -252.22911071777344
            },
            {
              "type": 21,
              "label": "Magnetometer magnitude",
              "unit": "uT",
              "available": true,
              "value": 404.04995727539062
            },
            {
              "type": 177,
              "label": "Orientation",
              "unit": "deg",
              "available": true,
              "x": -1.0909824875881402,
              "y": -14.997386162508205,
              "z": 116.594757887081
            }
          ]
        }
      ]
    },
    {
      "name": "sysinfo",
      "sensors": [
        {
          "id": 1,
          "name": "sysinfo",
          "model": "sysinfo()",
          "manufacturer": "Linux",
          "available": true,
          "values": [
            {
              "type": 66,
              "label": "System uptime",
              "unit": "s",
              "available": true,
              "value": 792074.0
            },
            {
              "type": 67,
              "label": "Load average (1 minute)",
              "unit": "CPUs",
              "available": true,
              "value": 0.4462890625
            },
            {
              "type": 68,
              "label": "Memory used",
              "unit": "%",
              "available": true,
              "value": 86.273808271072298
            },
            {
              "type": 69,
              "label": "Swap used",
              "unit": "%",
              "available": true,
              "value": 1.836009219110124
            },
            {
              "type": 70,
              "label": "Process count",
              "unit": "processes",
              "available": true,
              "value": 117.0
            }
          ]
        }
      ]
    }
  ]
}
Gateway application
The gateway application receives data transmitted by the node application. The application:
-
Stores received telemetry data to local disk in JSON format
-
Stores received images to local disk
-
Stores local telemetry data to local disk in the same JSON format
The gateway application provides an HTTP API for reading the telemetry data history and downloading the received images, and a WebSocket API for receiving real-time telemetry data updates.
As mentioned above, the application also displays selected details of signal quality and telemetry data also on the LCD screen.
Gateway UI
To make tracking the balloon simple, I’m developing a web-based user interface for the gateway application. It uses the HTTP and WebSocket APIs to display all sensor readings and the received thumbnail images. The UI draws the node (balloon tracker) route on map and it is possible to browse the telemetry data history.
The web UI is still very much a work in progress, so I’m only including this screenshot of complete telemetry data received from the node.
Next up
For the next blog post, I will be publishing source code for the first release of the tracker software called Embedded Radio Tracker and I will explain in detail how it works. I will also be performing tests for the radio transmissions with different antennas and transmit power to get a general idea of the range of LoRa transmissions before actually proceeding with planning the balloon flight.
You can follow me on Twitter at @mikaelnou where I will tweet about new blog posts when they are published.