Making tracking of the high-altitude balloon flight OH3HAB 7 a community effort. Watch the epic landing in a river!
The high-altitude balloon flight OH3HAB #7, launched on September 2nd 2023 by amateur radio club OH3AA in Hämeenlinna, Finland, was a special flight with two new technical experiments: a RadSens radiation sensor based on a Geiger tube and an image transmitter using the Wenet modulation. The flight payloads included a Vaisala RS41 radiosonde that was repurposed for amateur radio use and a Raspberry Pi Zero W with a Uputronics LoRa board to transmit photographs. With the transmissions of the position and image data available for anyone to receive easily, tracking of the flight became a true community effort!
This article is also available in Finnish on the OH3AA website.
Tämä artikkeli on luettavissa myös suomeksi Hämeenlinnan Radioamatöörit ry:n nettisivuilla.
Videos from the flight and of the flight preparations
An overview of the flight launch, balloon burst and landing. Watch the epic landing in a river and recovery of the flight payloads using a boat:
Flight launch preparations (filmed by Martti OH1ON), audio in Finnish only:
Unedited videos from the flight
Flight launch (3 minutes):
Balloon burst (3 minutes):
Landing in a river (3 minutes):
Raw video of the full flight (2.5 hours):
Flight transmitters: making tracking of the flight a community effort
The idea behind choosing the flight transmitters was to make tracking of the flight a community effort, where anyone — with suitable, cheap radio receiver hardware — could participate in tracking the flight. This time we also included a transmitter for photographs, as while it is great to be able to track the flight of a high-altitude balloon on a map, it is even more interesting to be able to see photos taken from the balloon — in real time, during the flight!
In addition to transmitting photos from the flight, we included a radiation sensor in the flight as an experiment to measure the level of ionizing radiation at high altitudes. Measuring radiation intensity on a high-altitude balloon flight is particularly interesting, because the intensity is considerably higher at high altitudes than at ground level where the atmosphere absorbs much of the radiation. The sensor readings could be monitored by anyone tracking the flight.
The transmitter devices were a Vaisala RS41 radiosonde transmitting the balloon GPS position and sensor telemetry data, and a special image transmitter sending photographs taken during the flight.
An important detail regarding the way the receiver software for both the position data and the images work is that they send the received data to centralized services, which then make the data available on the Internet for anyone to view.
These centralized services are:
-
Sondehub Amateur for the GPS position and sensor data
-
SondeHub Grafana dashboard for visualizing the position and sensor data using charts
-
ssdv.habhub.org for the images
We wrote down detailed instructions on how to set up a receiver station for each type of transmission and also provided links to the different websites that could be used to follow the flight even without a radio receiver. We advertised the flight on several different social media platforms, mailing lists and instant messaging groups, so that as many people as possible would know about the flight and could participate in tracking it.
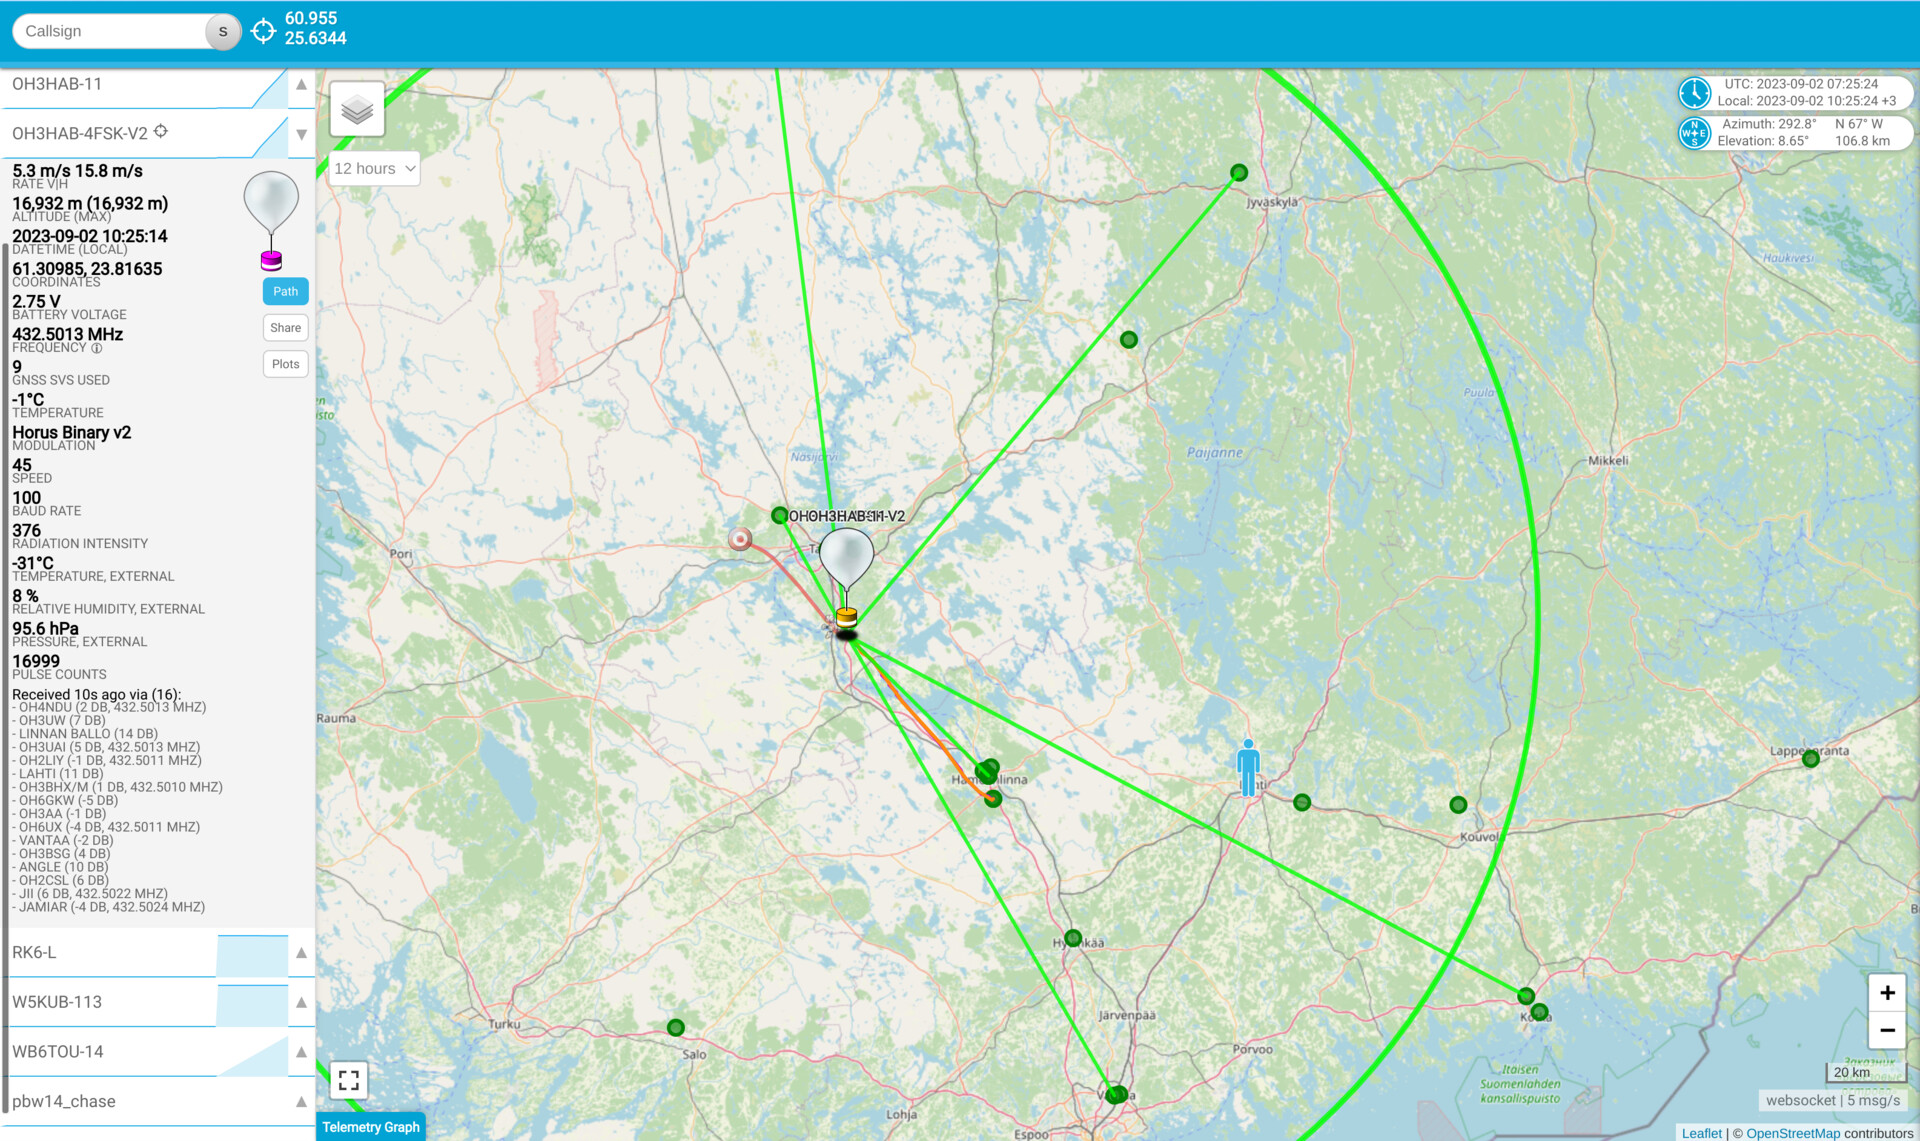
In the end we had 25 Horus 4FSK stations in Finland tracking the balloon position, which is a great achievement, and a couple of Wenet image receiver stations! There were also some APRS stations tracking the flight.
Vaisala RS41 radiosonde with a radiation sensor
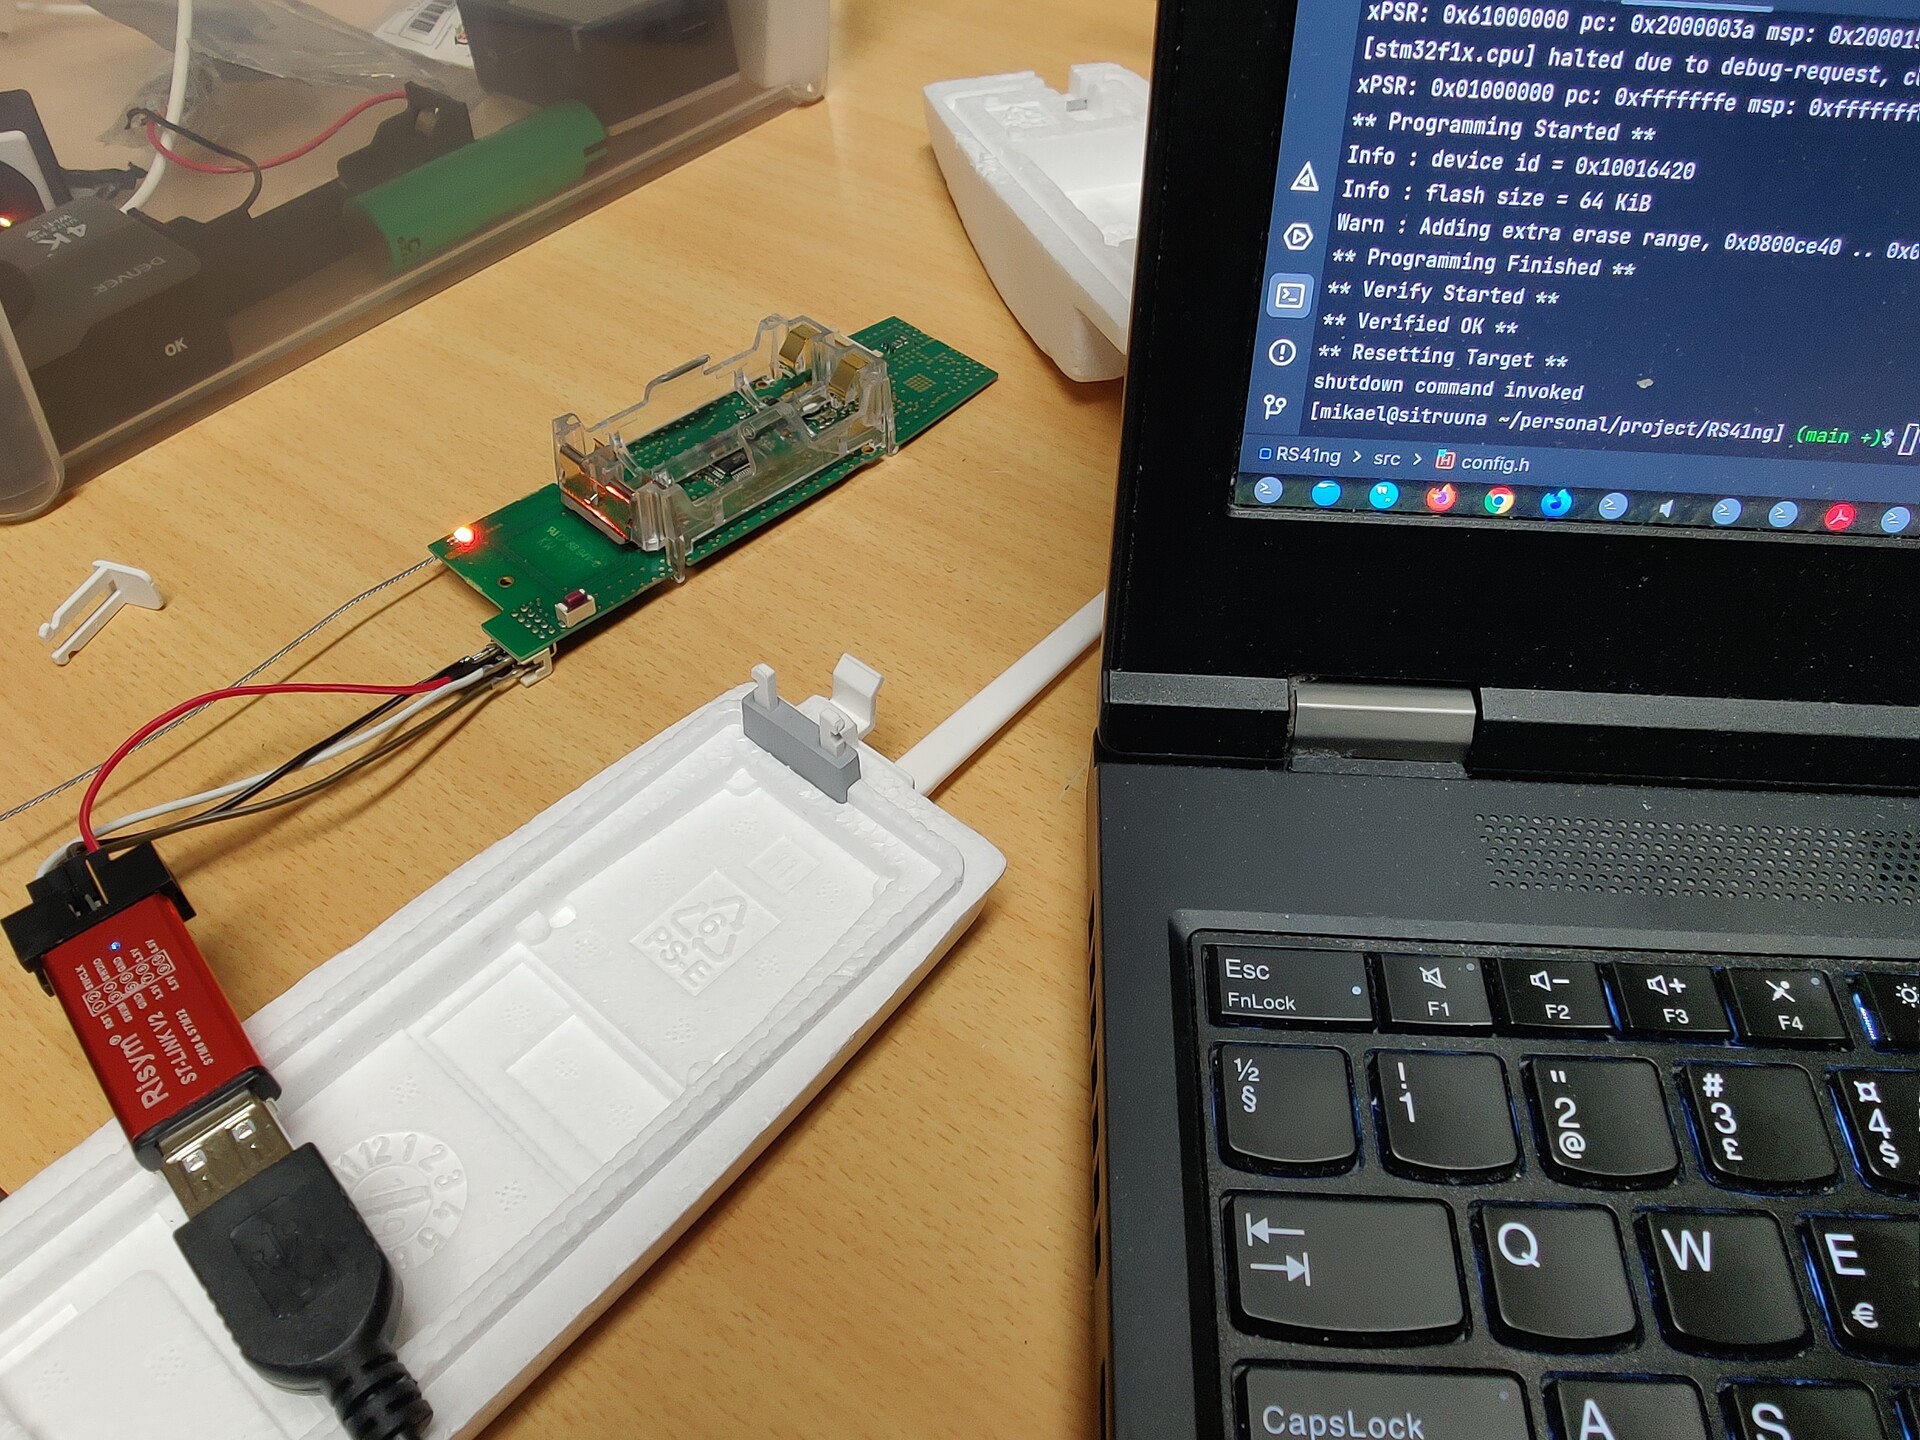
The flight used a Vaisala RS41 radiosonde again as the main flight tracker. The radiosonde was modified to transmit on the amateur radio 70cm band (432.500 MHz) and to send both Horus 4FSK and APRS packets with the GPS position and telemetry data from the sensors. The Horus transmission can be received by anyone with an SSB receiver for the 70cm band and a computer running the Horus GUI software!
RS41 radiosondes are reusable and launched daily by meteorological institutes around the world (FMI in Finland), which makes them great for tracking amateur radio high-altitude balloon flights. Read more about repurposing radiosondes for amateur radio high-altitude balloon tracking.
The RS41 radiosonde was equipped with a Geiger tube-based sensor for ionizing radiation, called RadSens, and a Bosch BME280 temperature/humidity/pressure sensor. Both of the sensors were connected to the I²C bus of the radiosonde.
See the results from the radiation sensor measurements near the end of this article!
The RS41ng open-source amateur radio firmware for the radiosonde was adapted to support the additional sensors. For more information on how to reuse radiosonde hardware and how to track and to find them, please read the RS41ng firmware documentation.
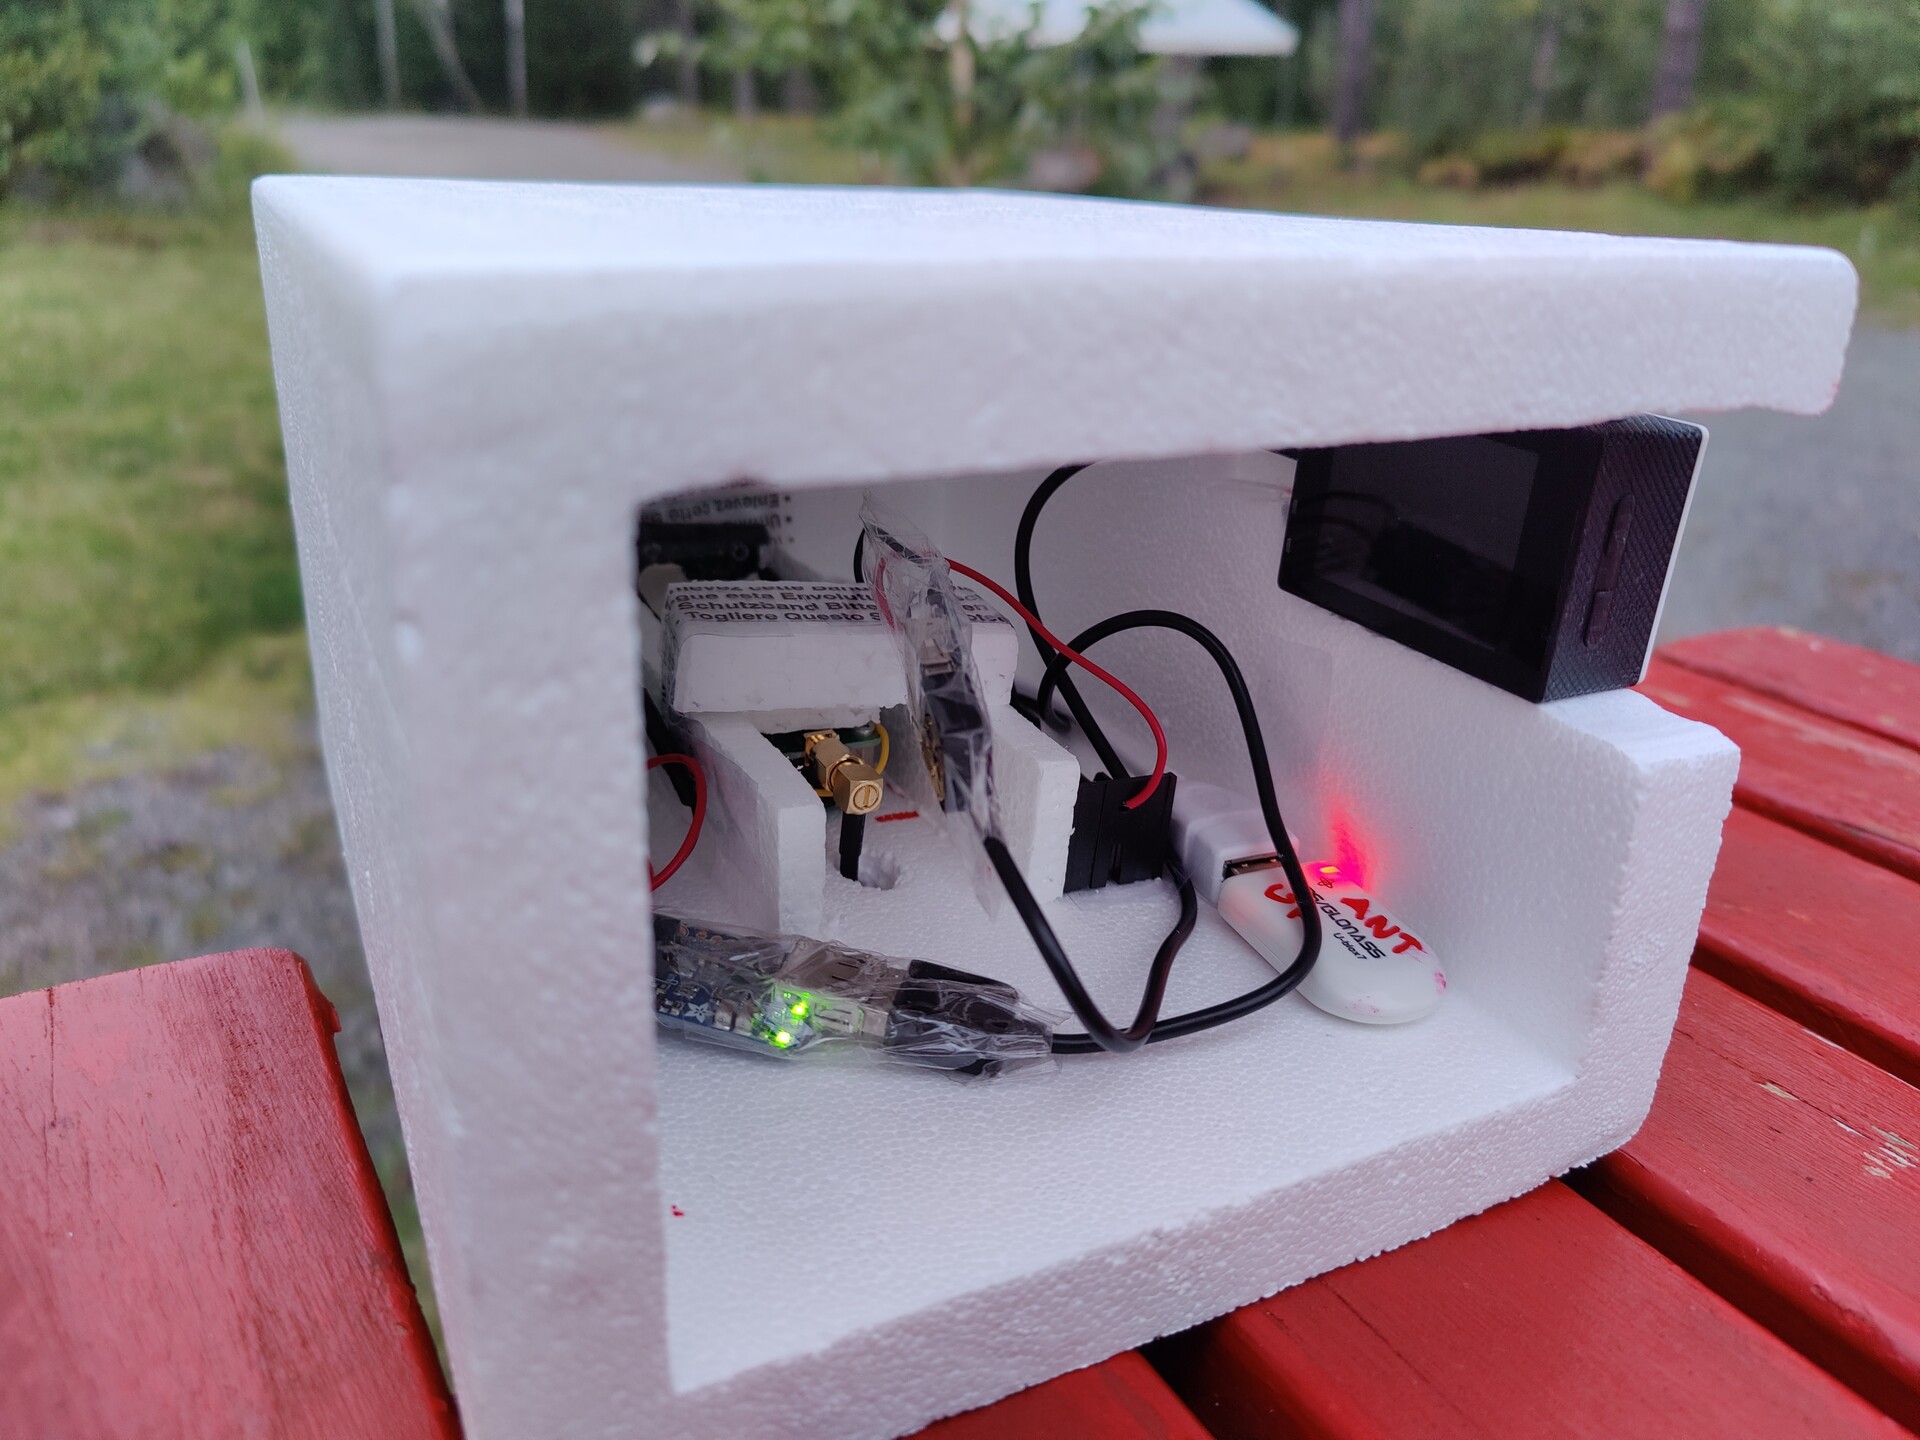
Wenet image transmitter: Raspberry Pi Zero W with LoRa board
The second transmitter was a Raspberry Pi Zero W with a Uputronics LoRa board to transmit photographs using the Wenet modulation. The Raspberry Pi Zero W was running the Wenet transmitter software.
The way Wenet works is that the transmitter software reads a JPEG image file taken by the Raspberry Pi camera, encodes it in multiple small packets using the SSDV encoder and then transmits it using the LoRa radio chip in 2FSK mode (and not the LoRa modulation).
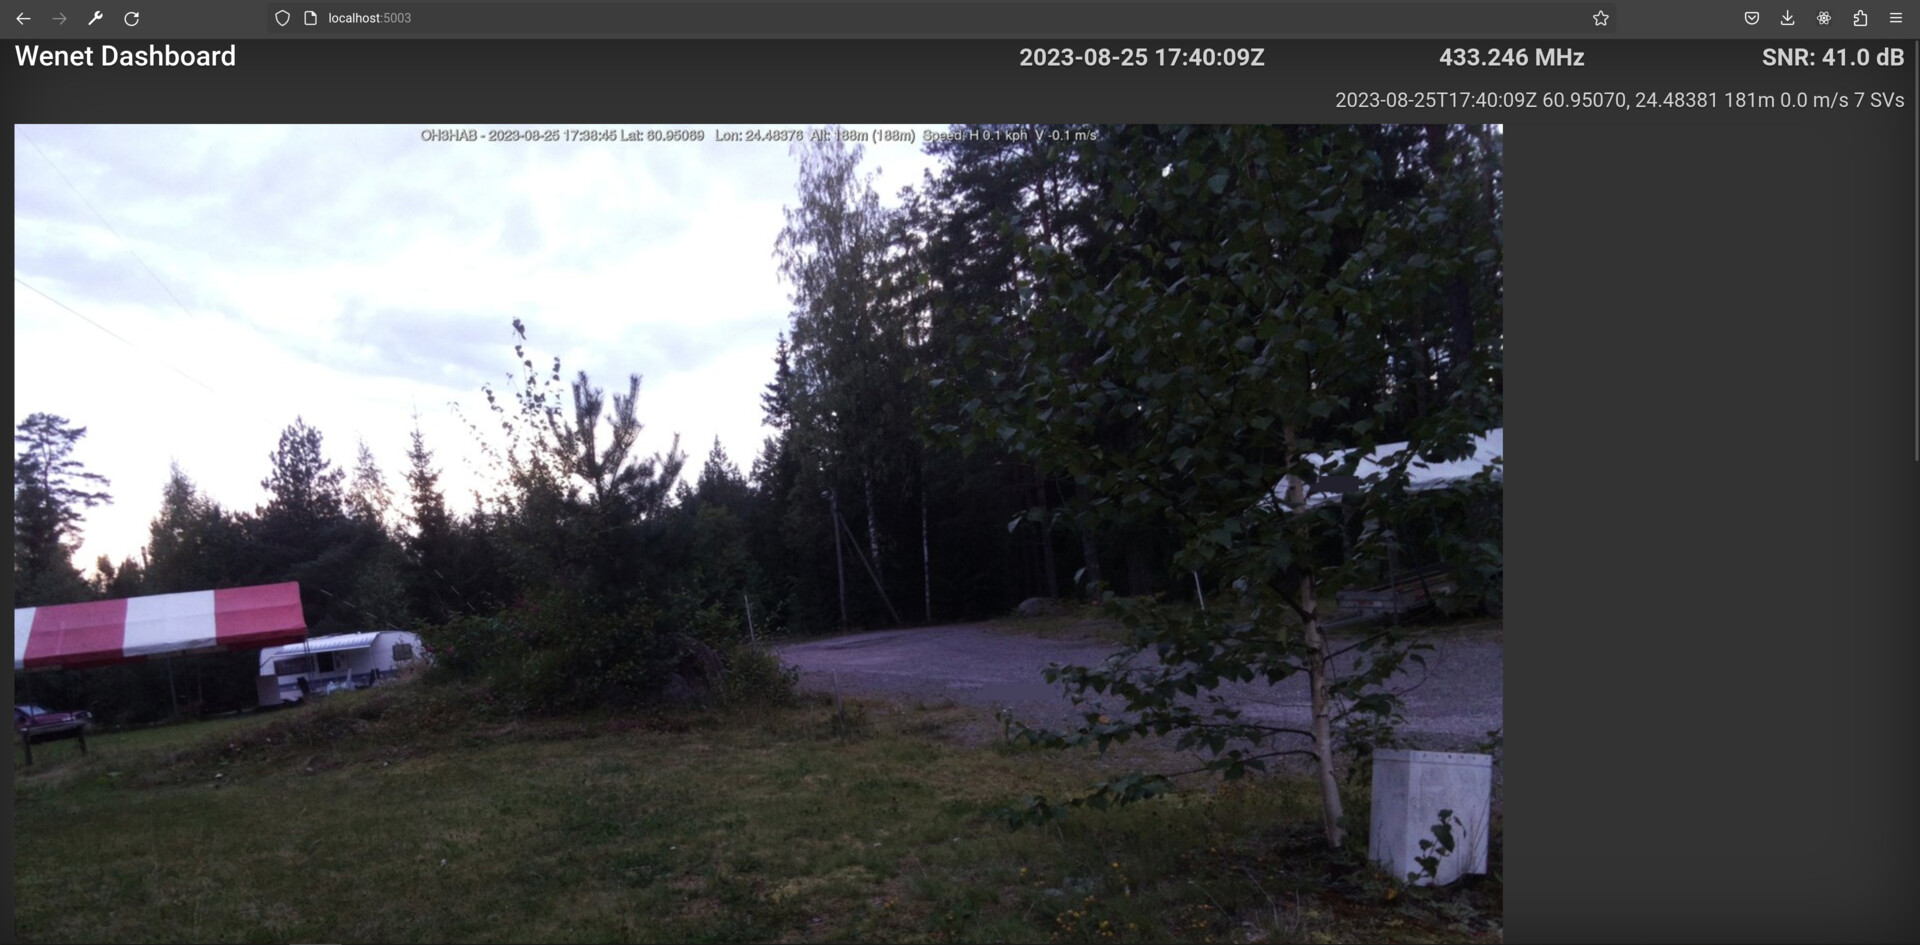
The Wenet receiver software then receives the image and displays it in a web browser. The Wenet receiver software also sends the received image packets to centralized server ssdv.habhub.org, which collects image packets from multiple receivers and combines them into a single image. This way anyone can view the photos from the flight, even without having a Wenet receiver.
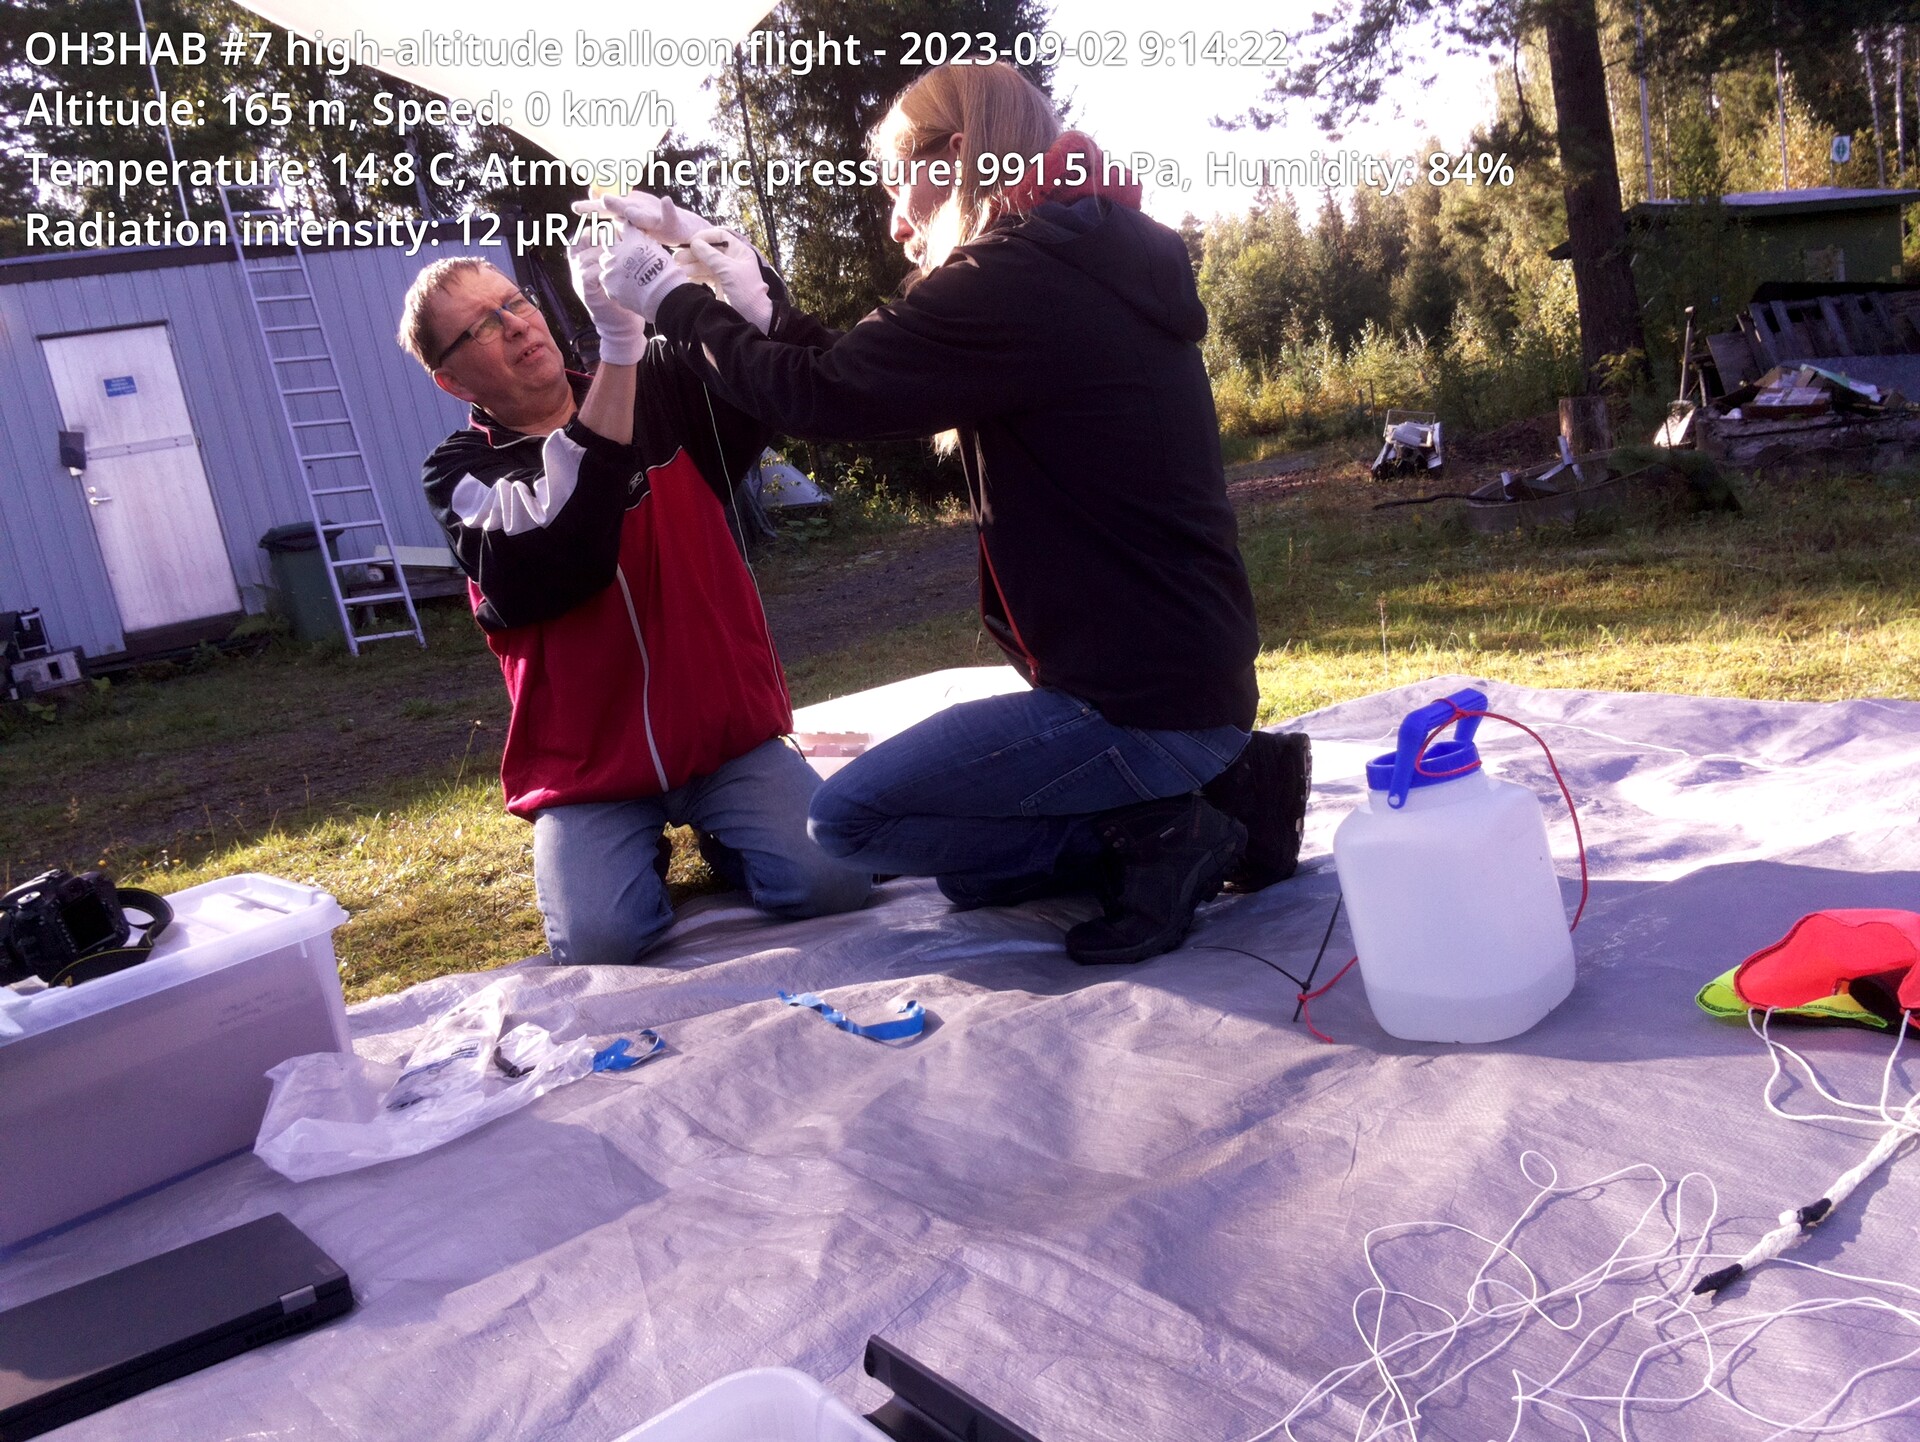
Flight preparations and launch
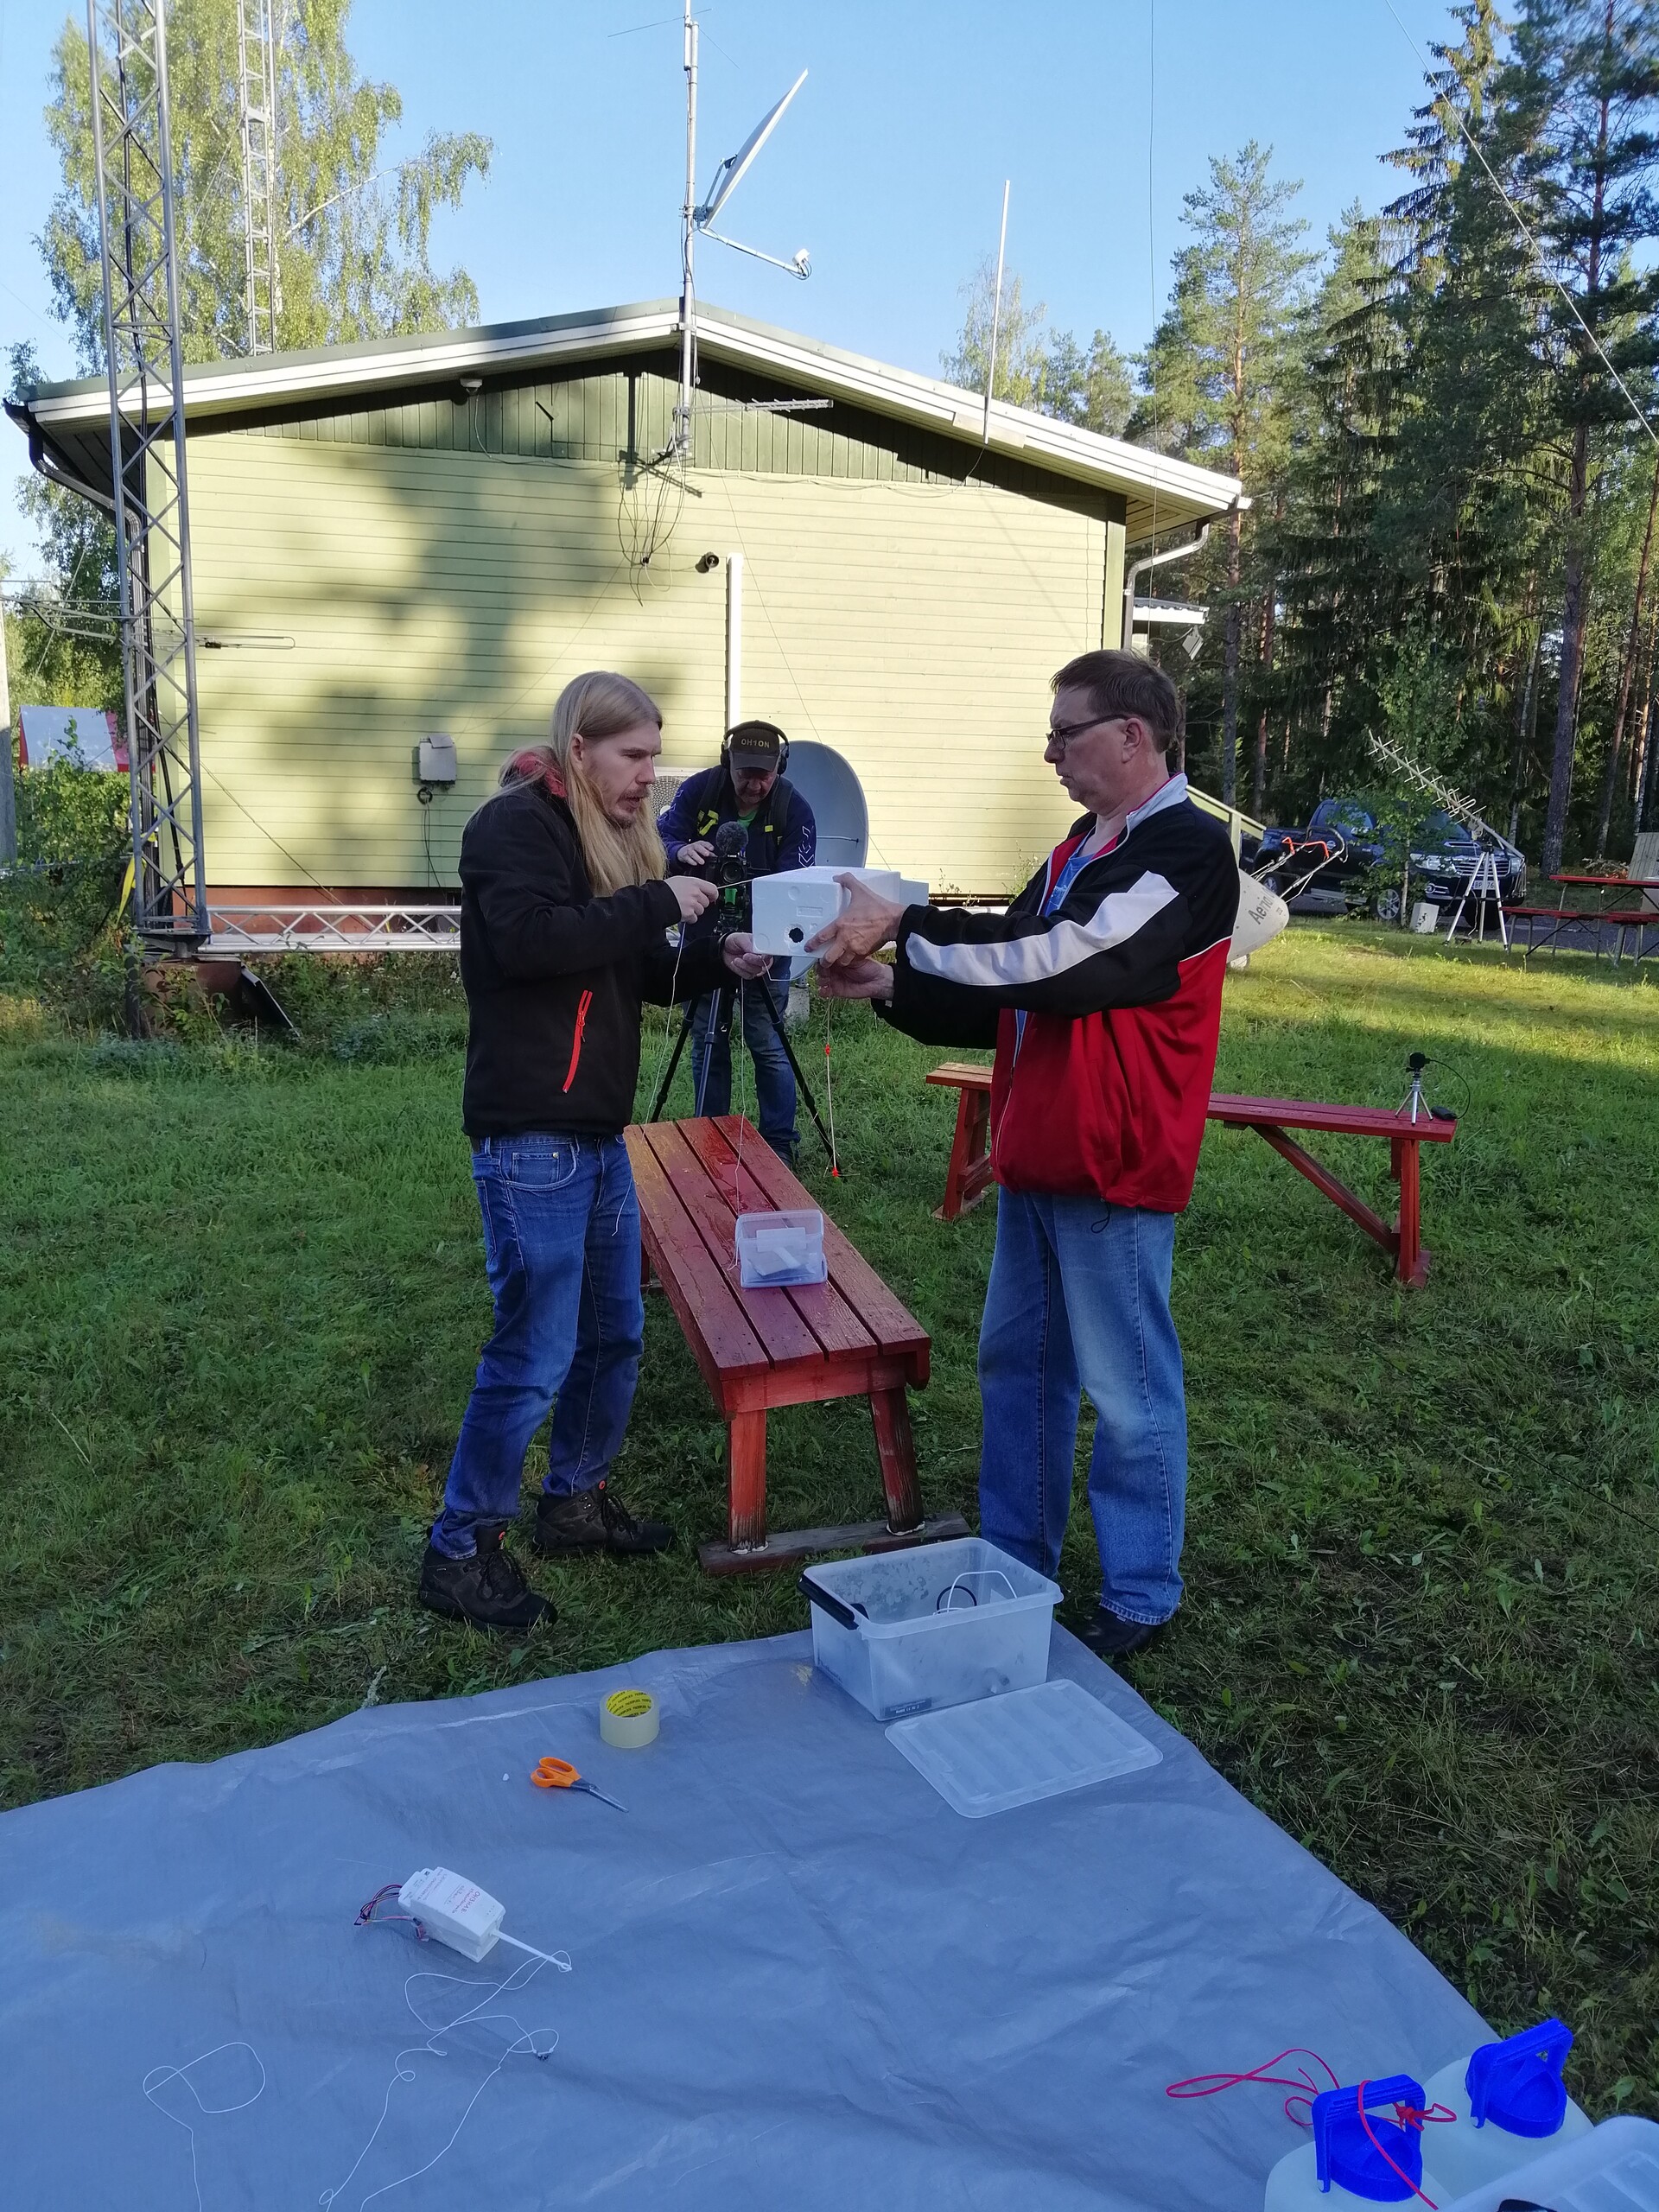
The weather forecast for the launch weekend was quite challenging, because there were a lot of rain areas nearby and the winds in the upper atmosphere were strong. However, Saturday morning September 2nd was sunny and calm, so we agreed to launch the balloon at 9:00 AM local time. We were at the launch site already before 8:00 to start preparations for the flight. The next rain area would reach the launch site around 11:00 AM, so we didn’t have time to waste!
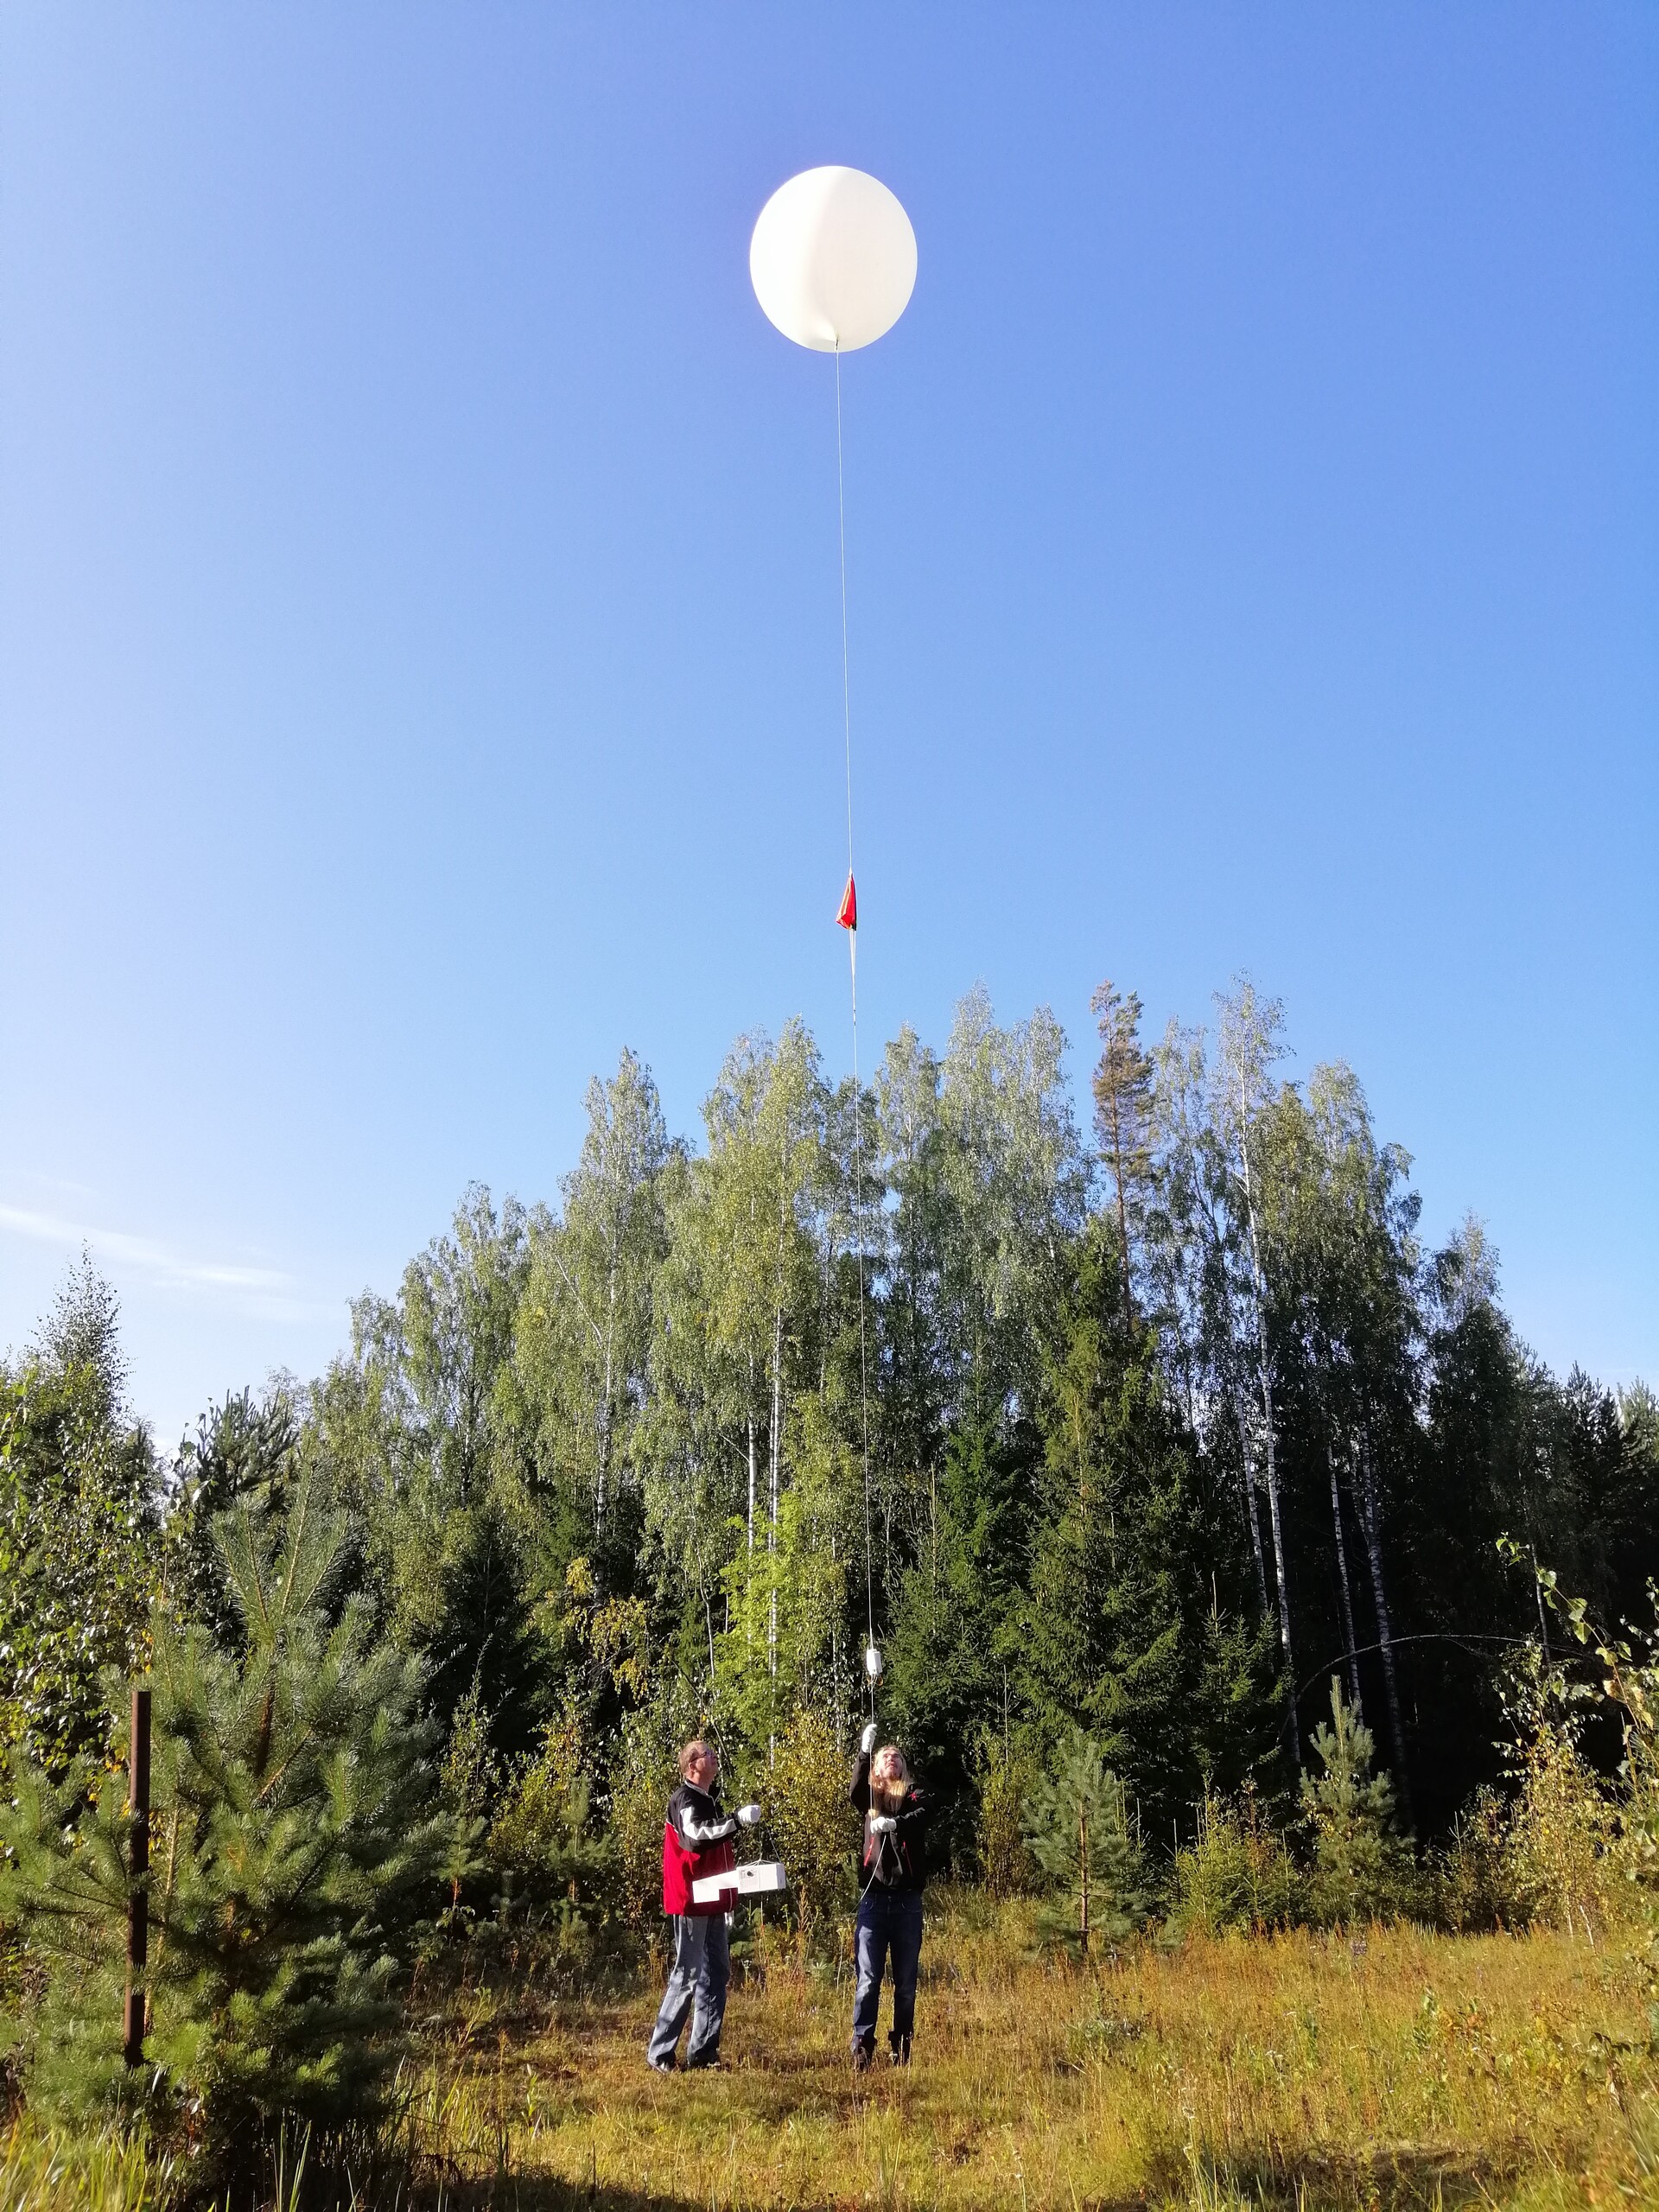
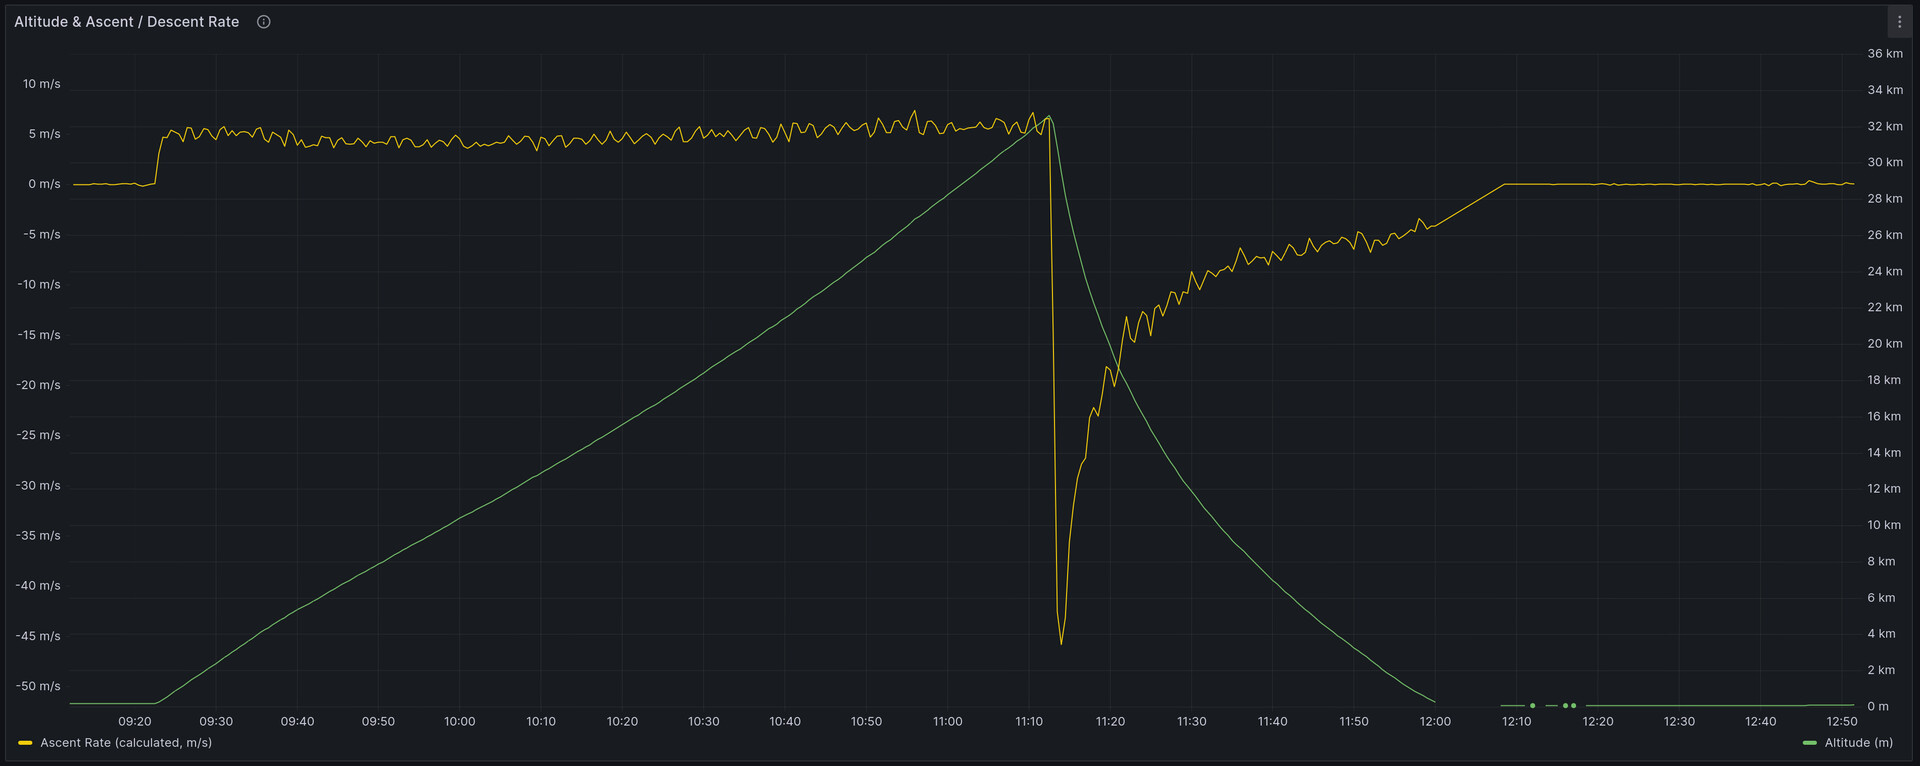
We calculated the required lift for the balloon using the Sondehub burst calculator tool. We used a Hwoyee 600g latex balloon for the flight, and the weight of the flight payload (transmitters and parachute) was also about 600g. We chose the desired ascent rate to be 5 m/s, so that the flight would not take too long and the balloon would not fly too far from the launch site. Our goal was also to reach an altitude of about 30 km — by using more hydrogen gas the balloon would burst at a lower altitude.
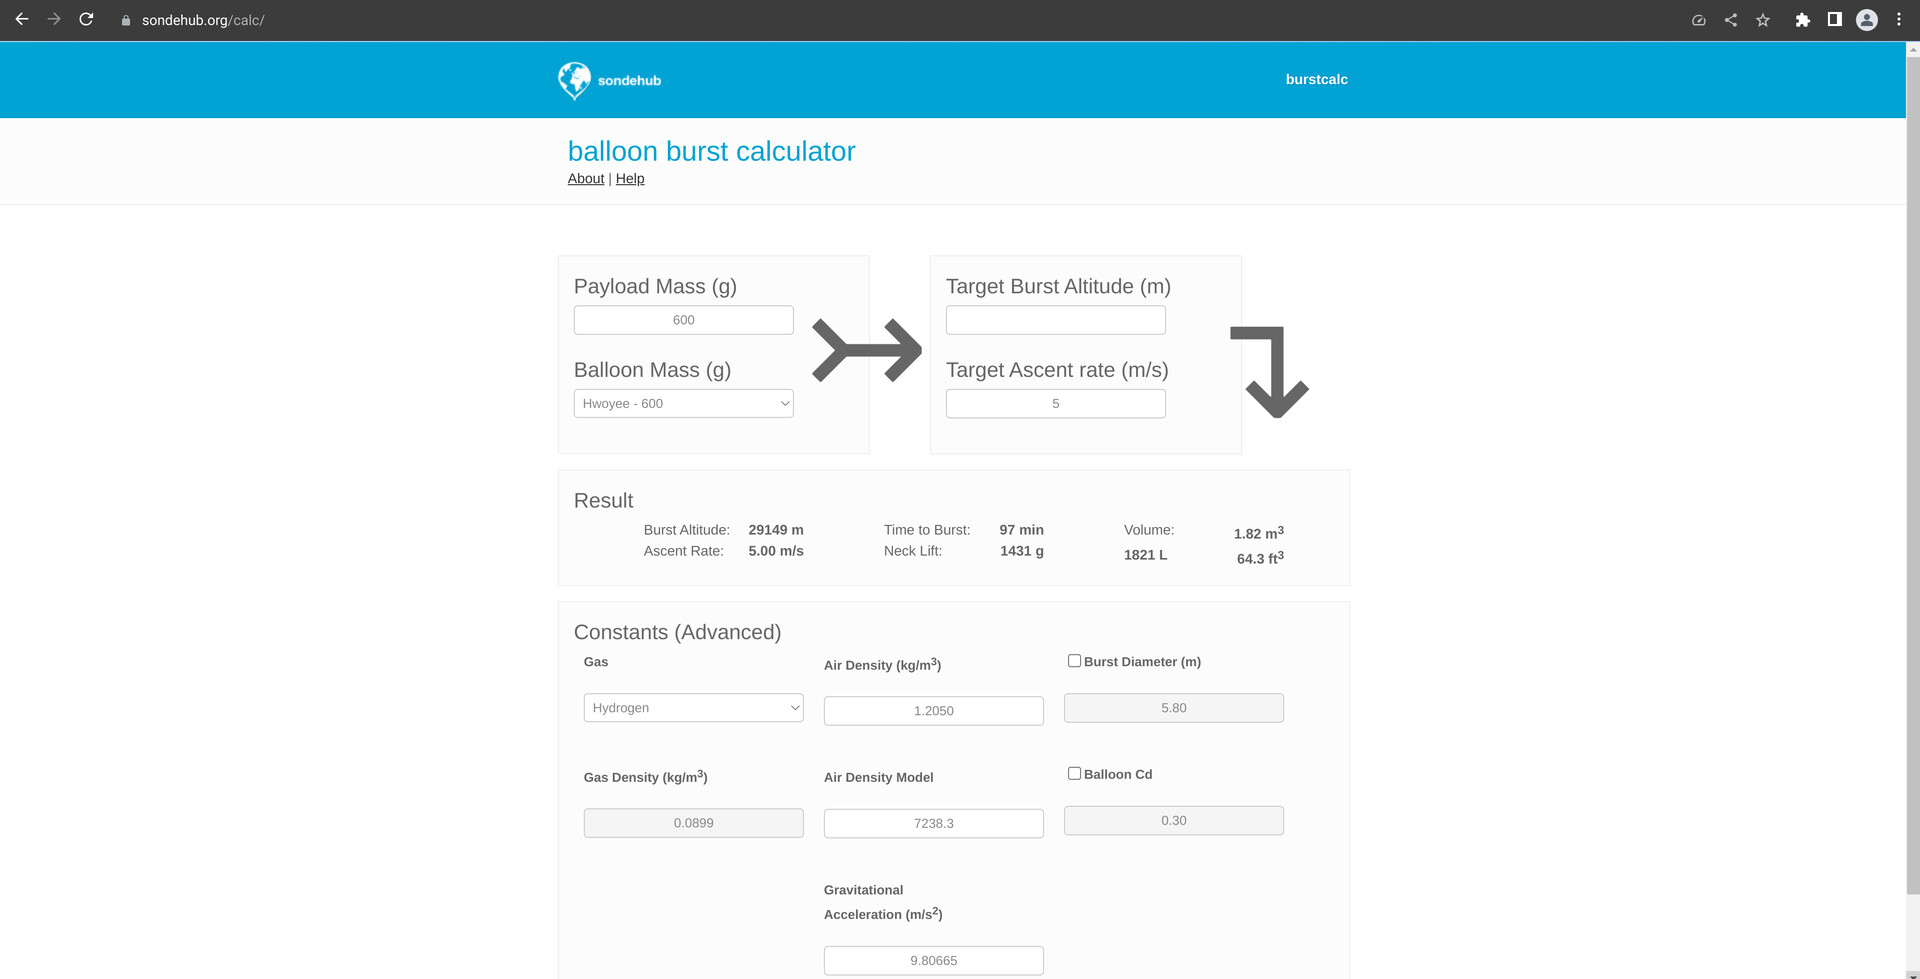
The burst calculator tool (above) showed an altitude forecast of about 29 kilometers and a required lift of 1431 grams. We weighed the required amount of water with a regular kitchen scale in a container and filled the balloon until it was able to lift the container.
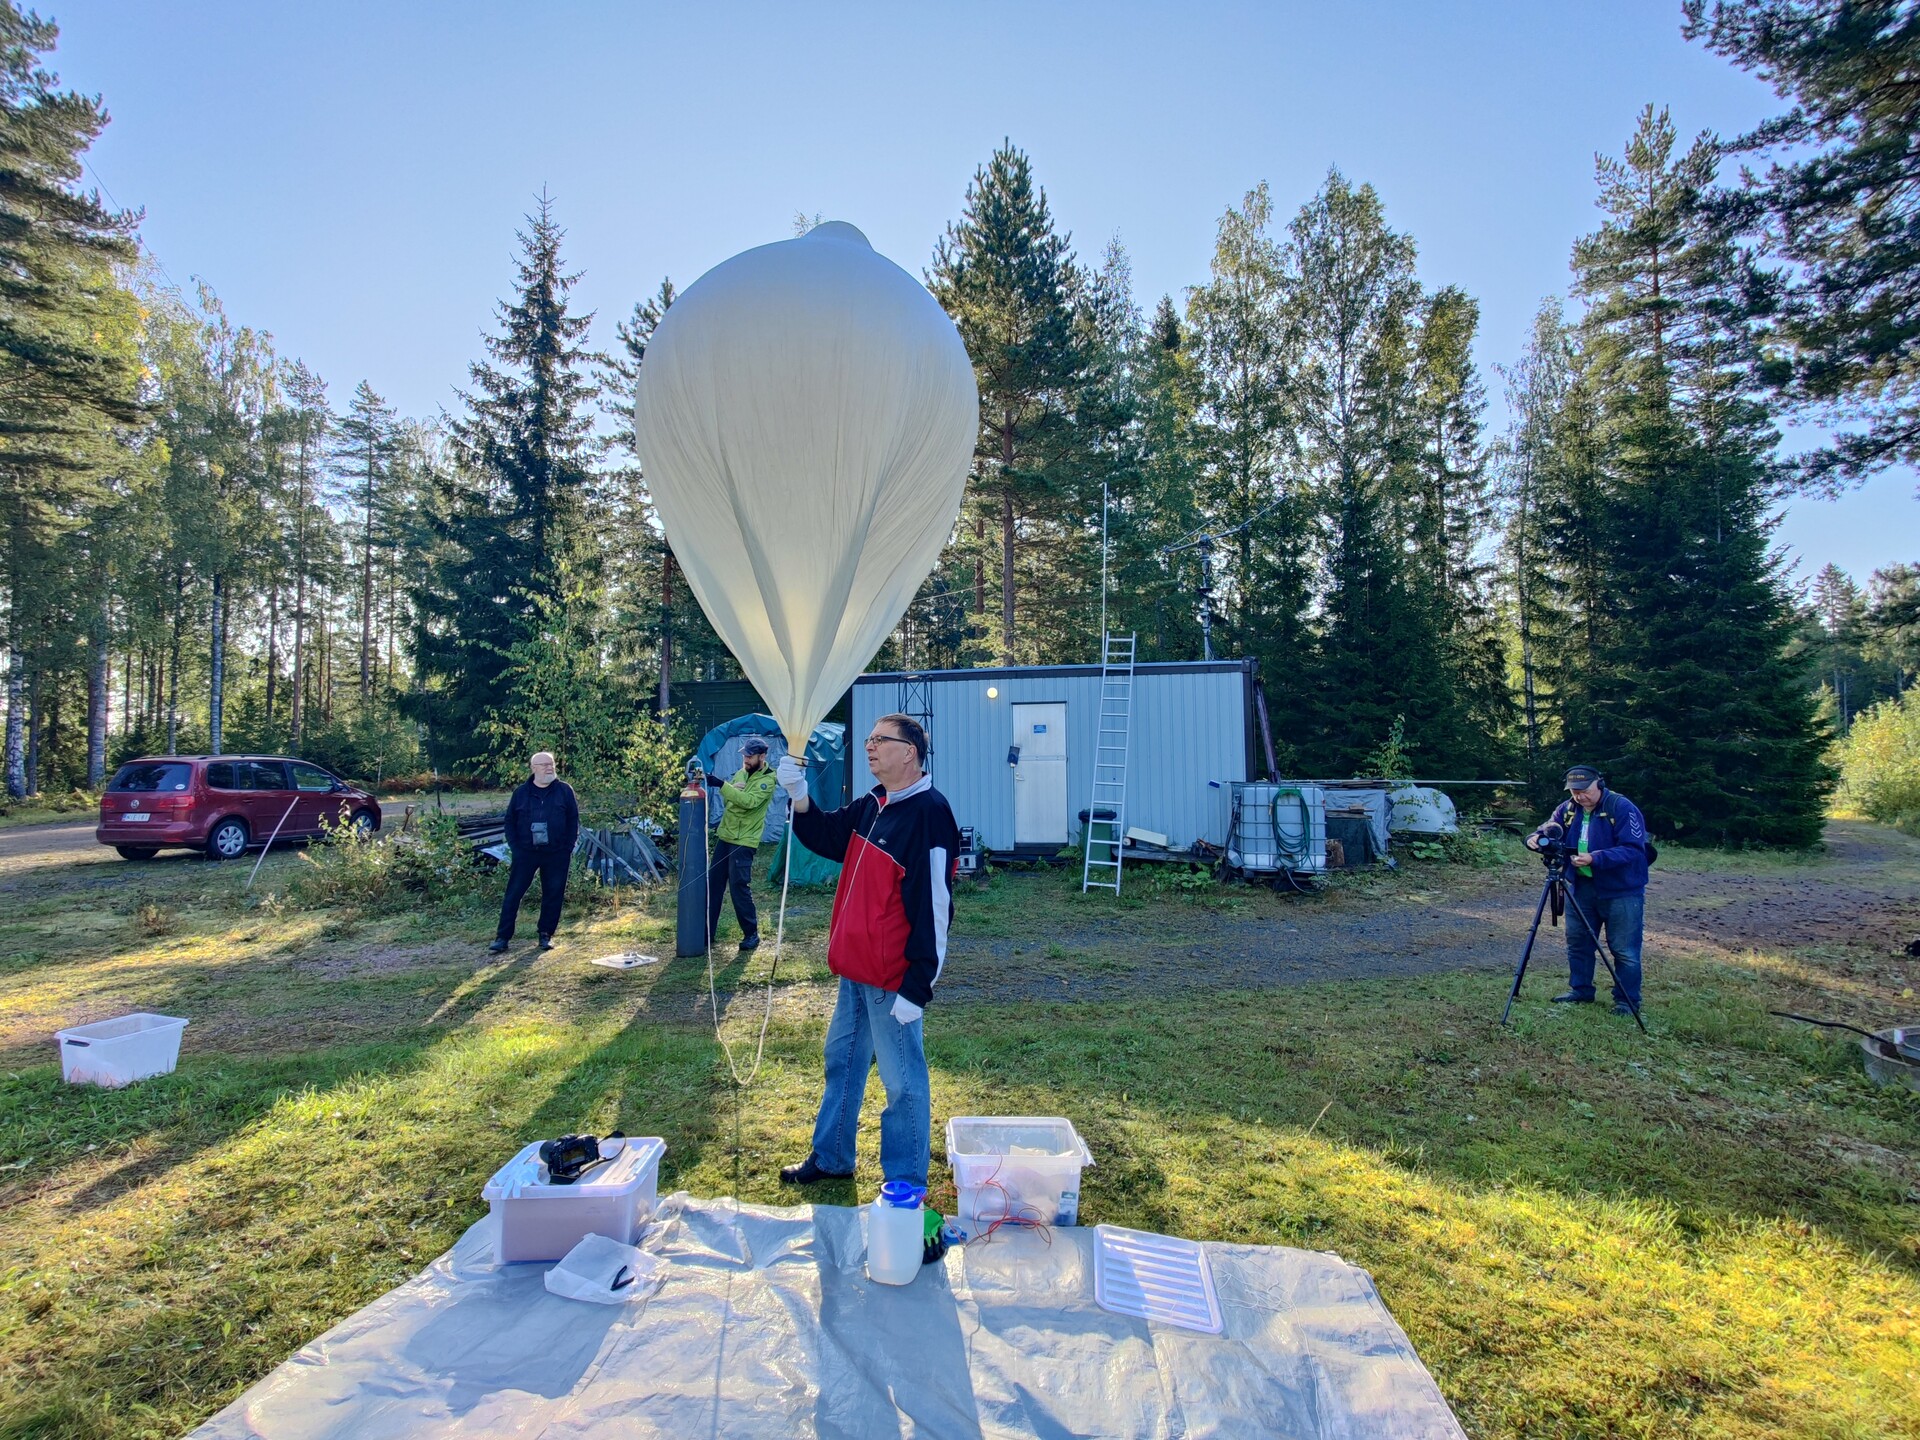
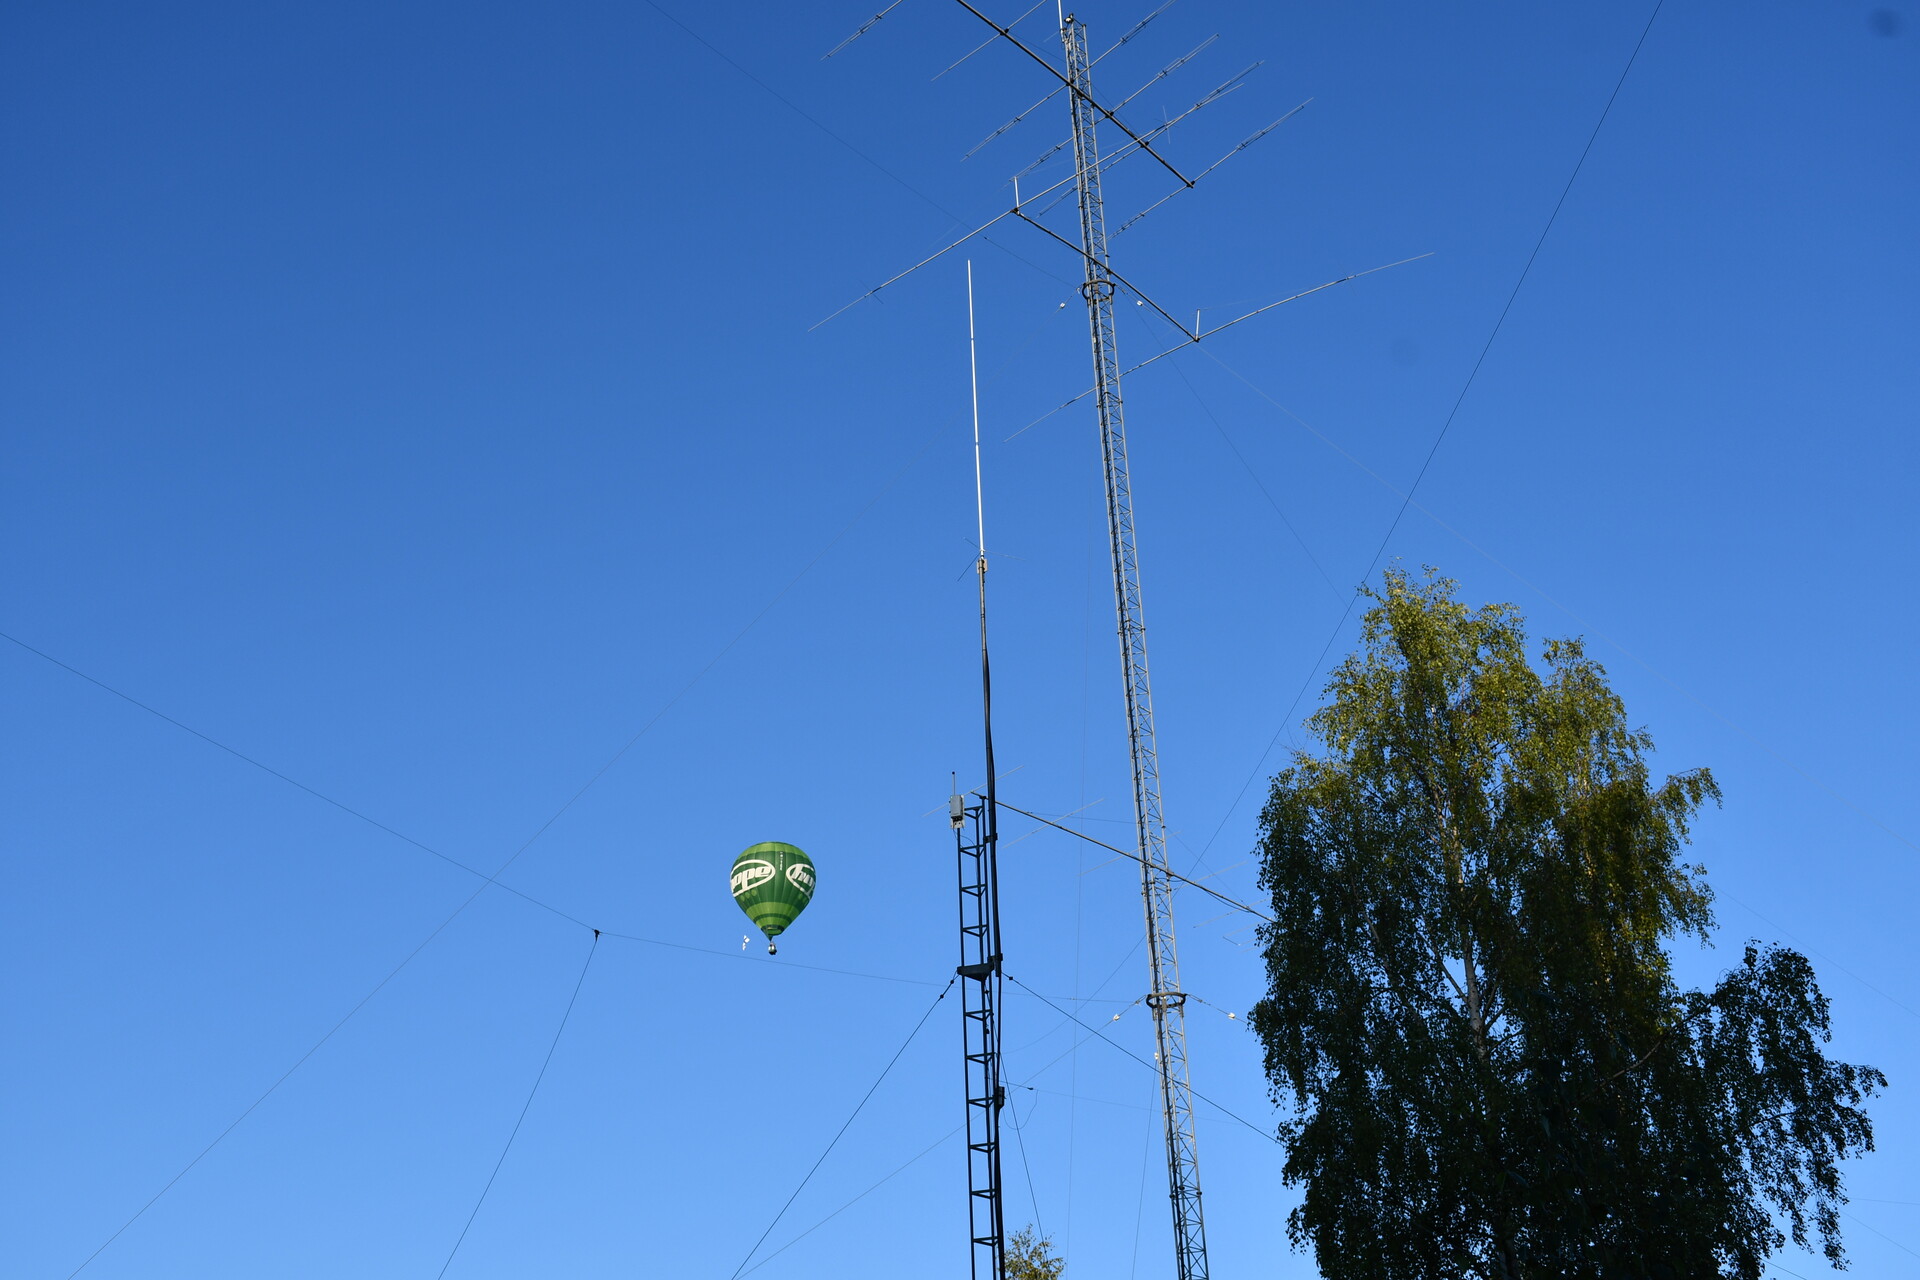
We launched the balloon from the Miemala area in Hämeenlinna, next to the OH3AA clubhouse. The core team responsible for the launch was Jari OH3UW, Sami OH3EYZ and Mikael OH3BHX. Martti OH1ON arrived to film the launch. Club members Harri OH3YG and Timo OH3CT were also watching the launch.
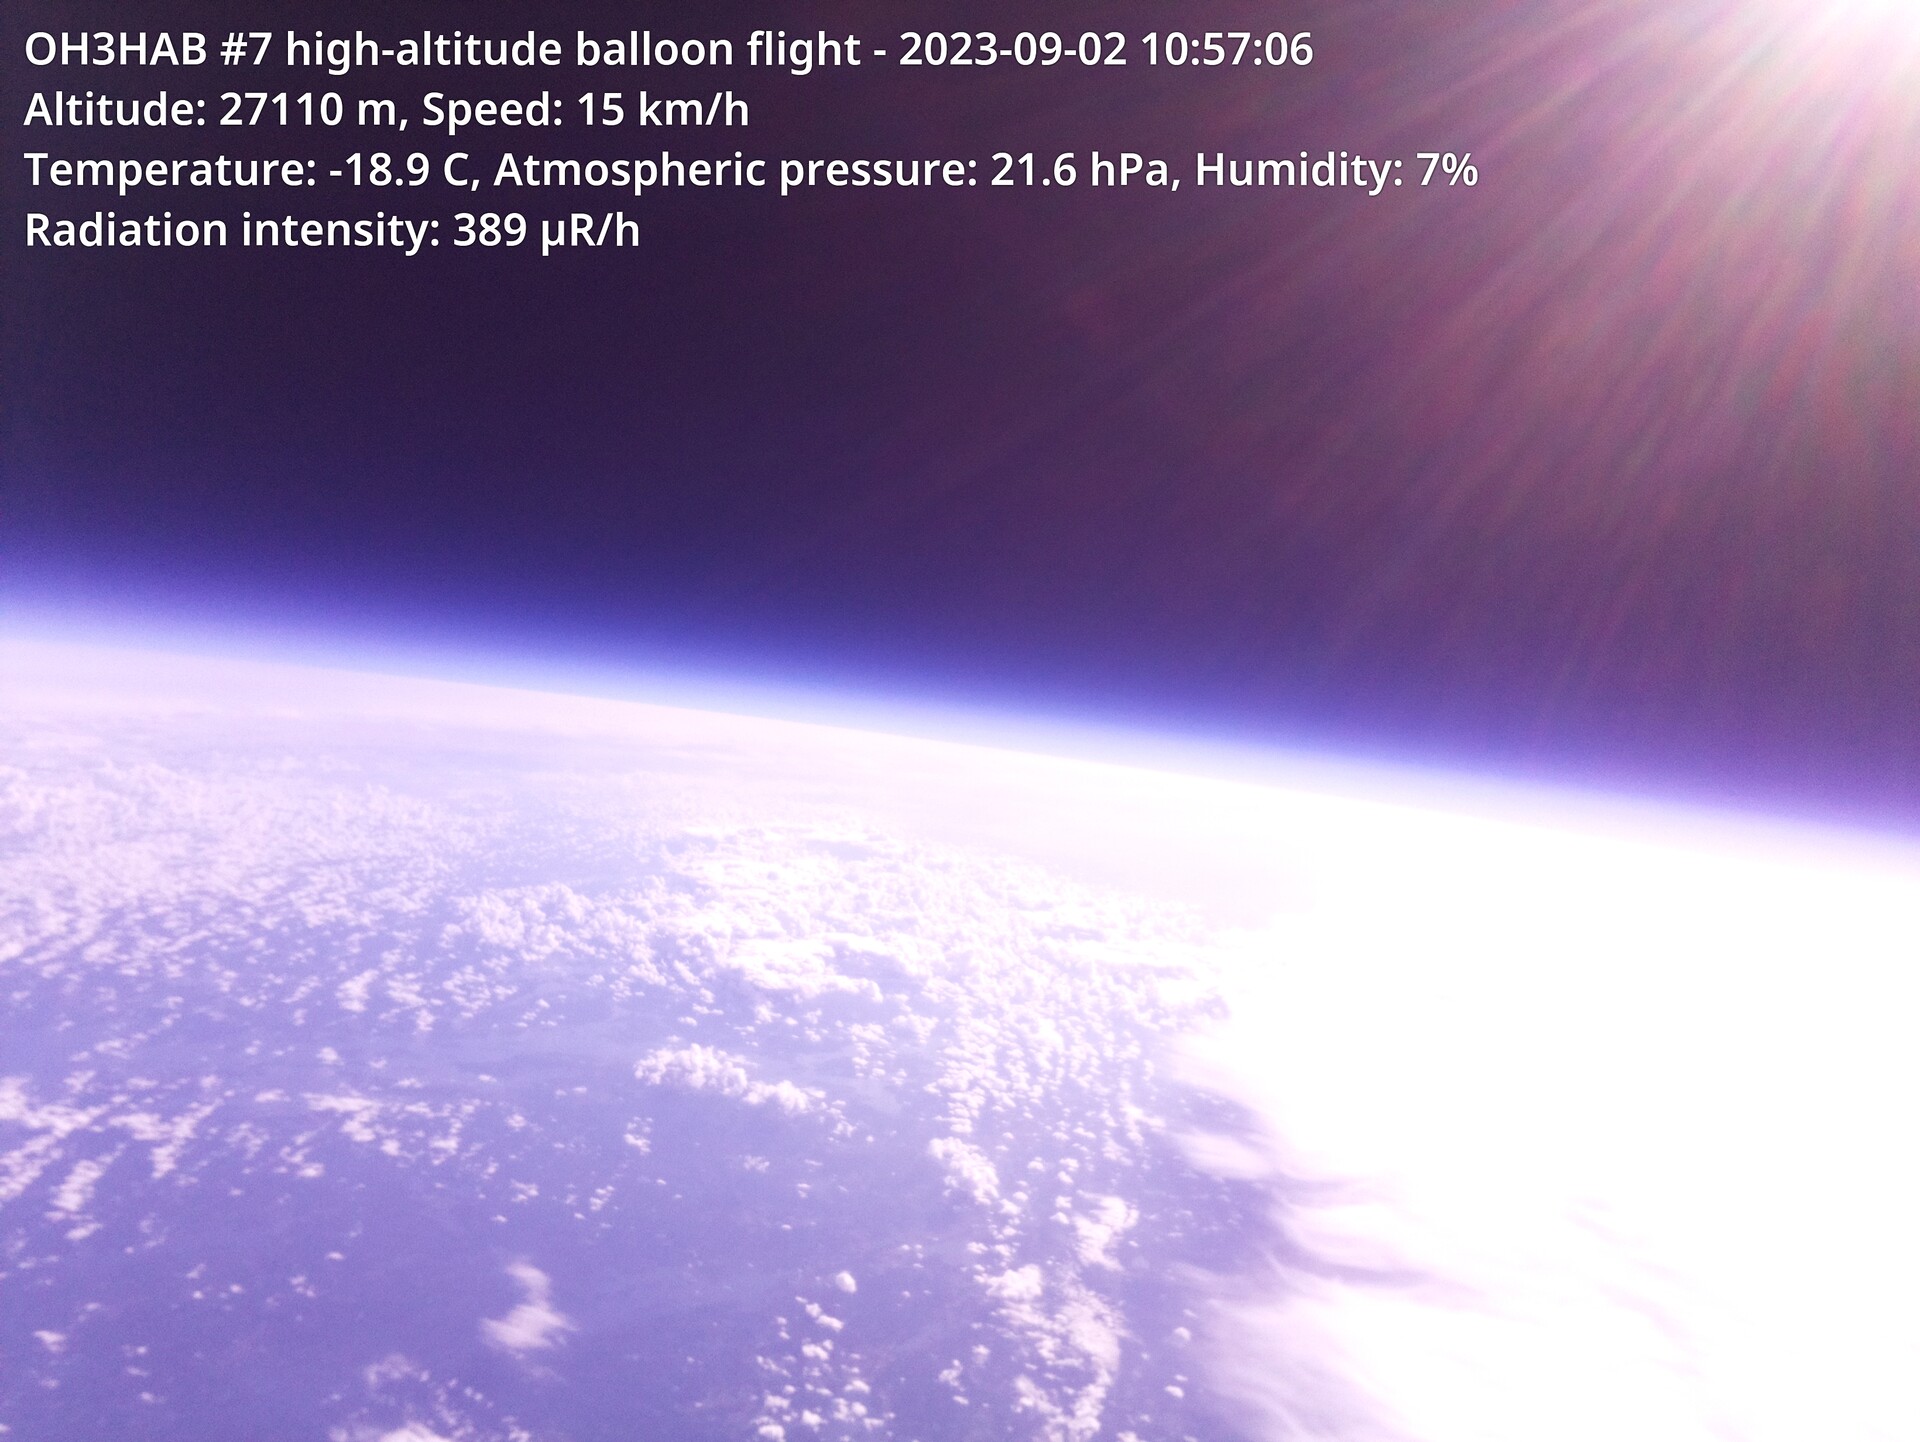
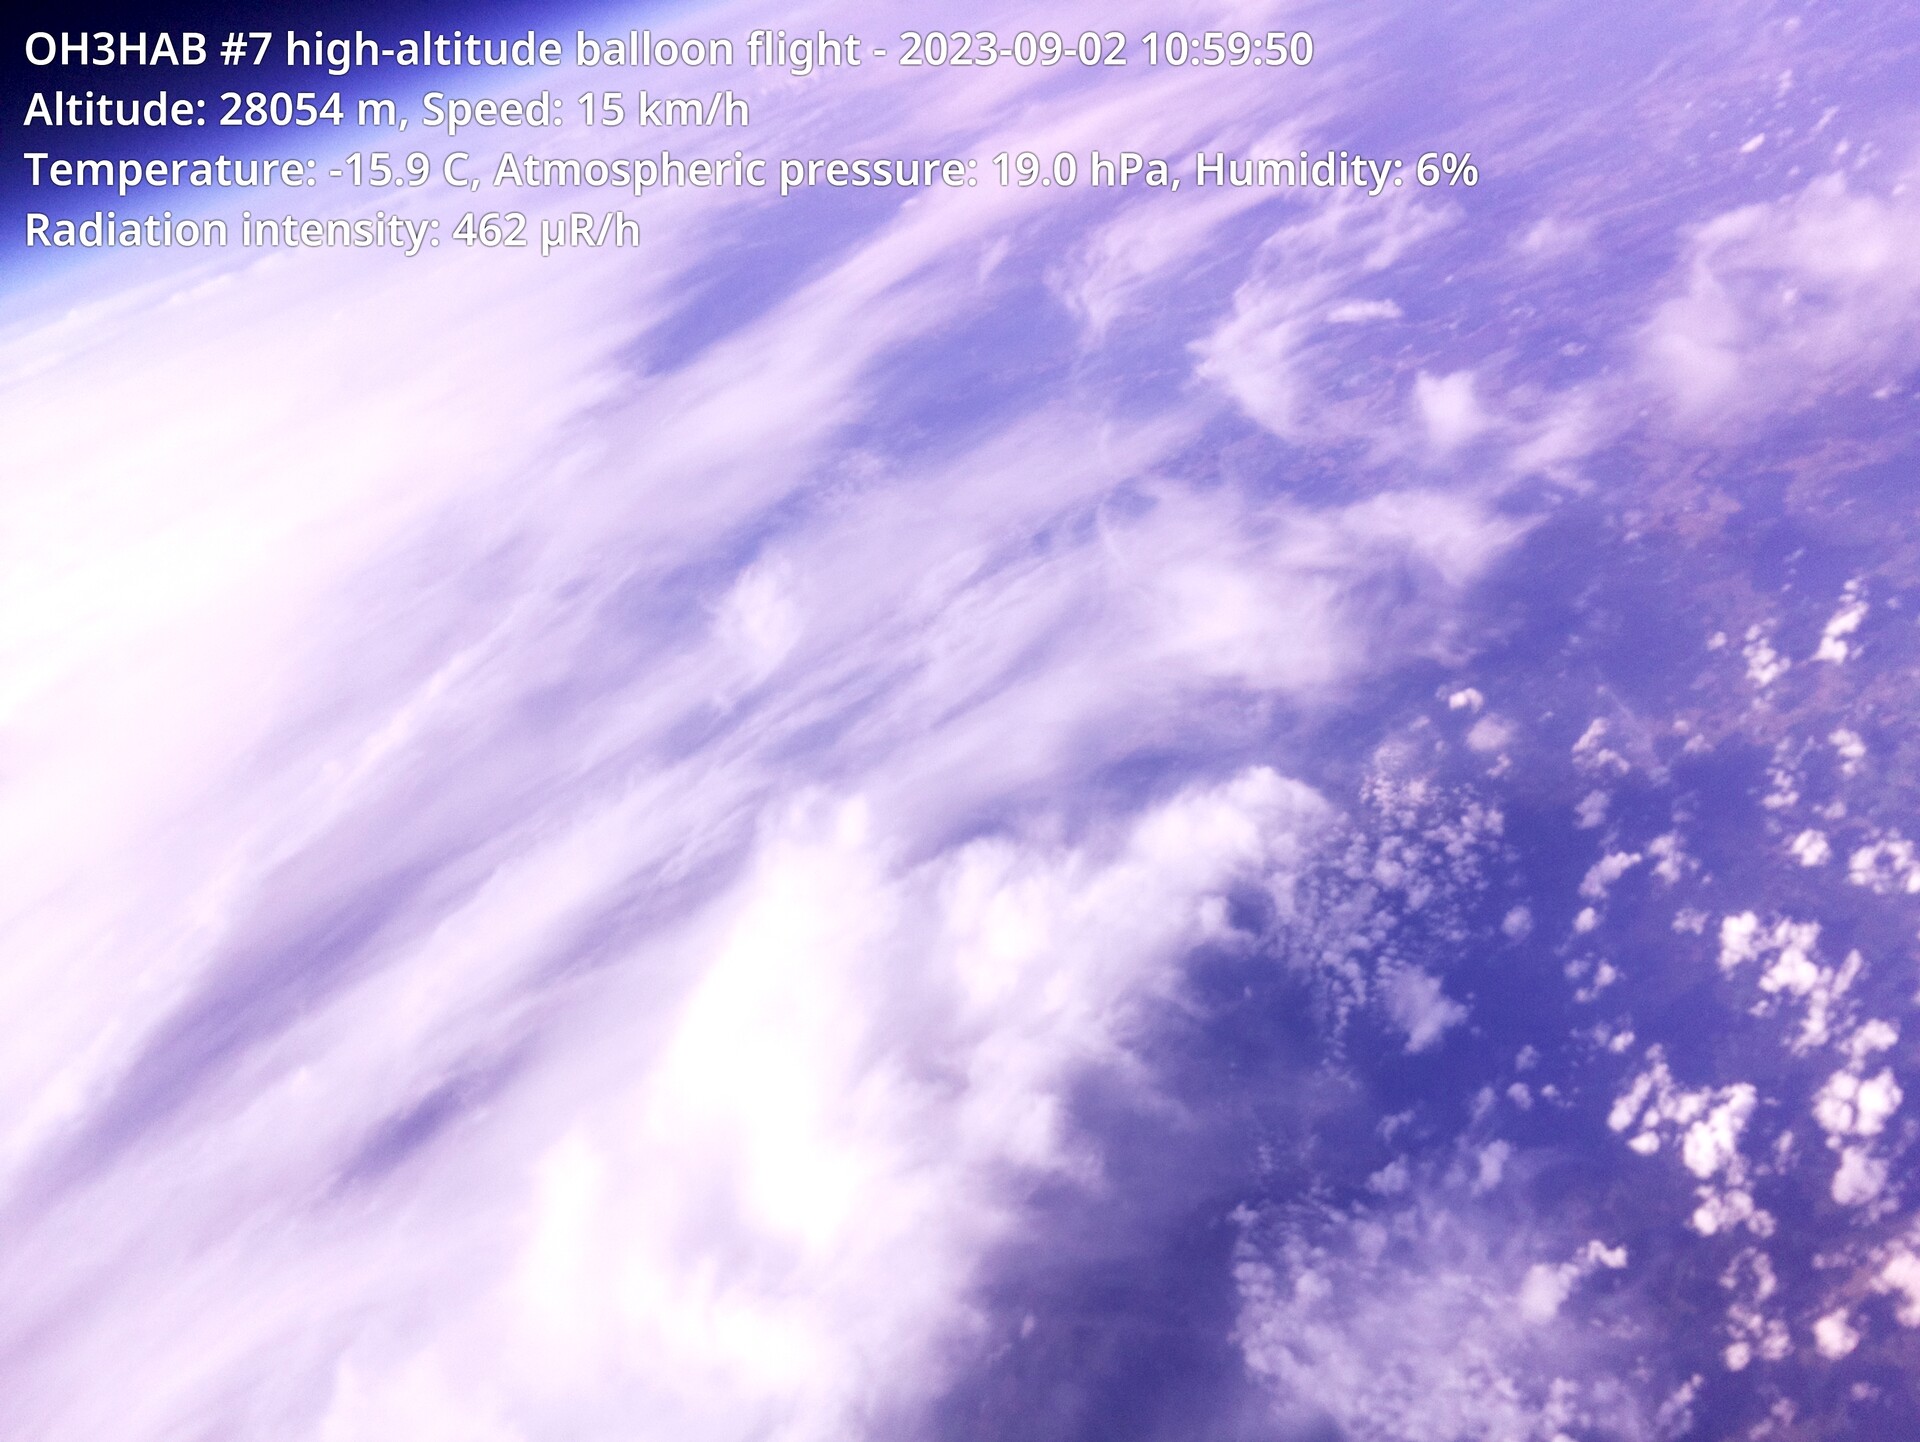
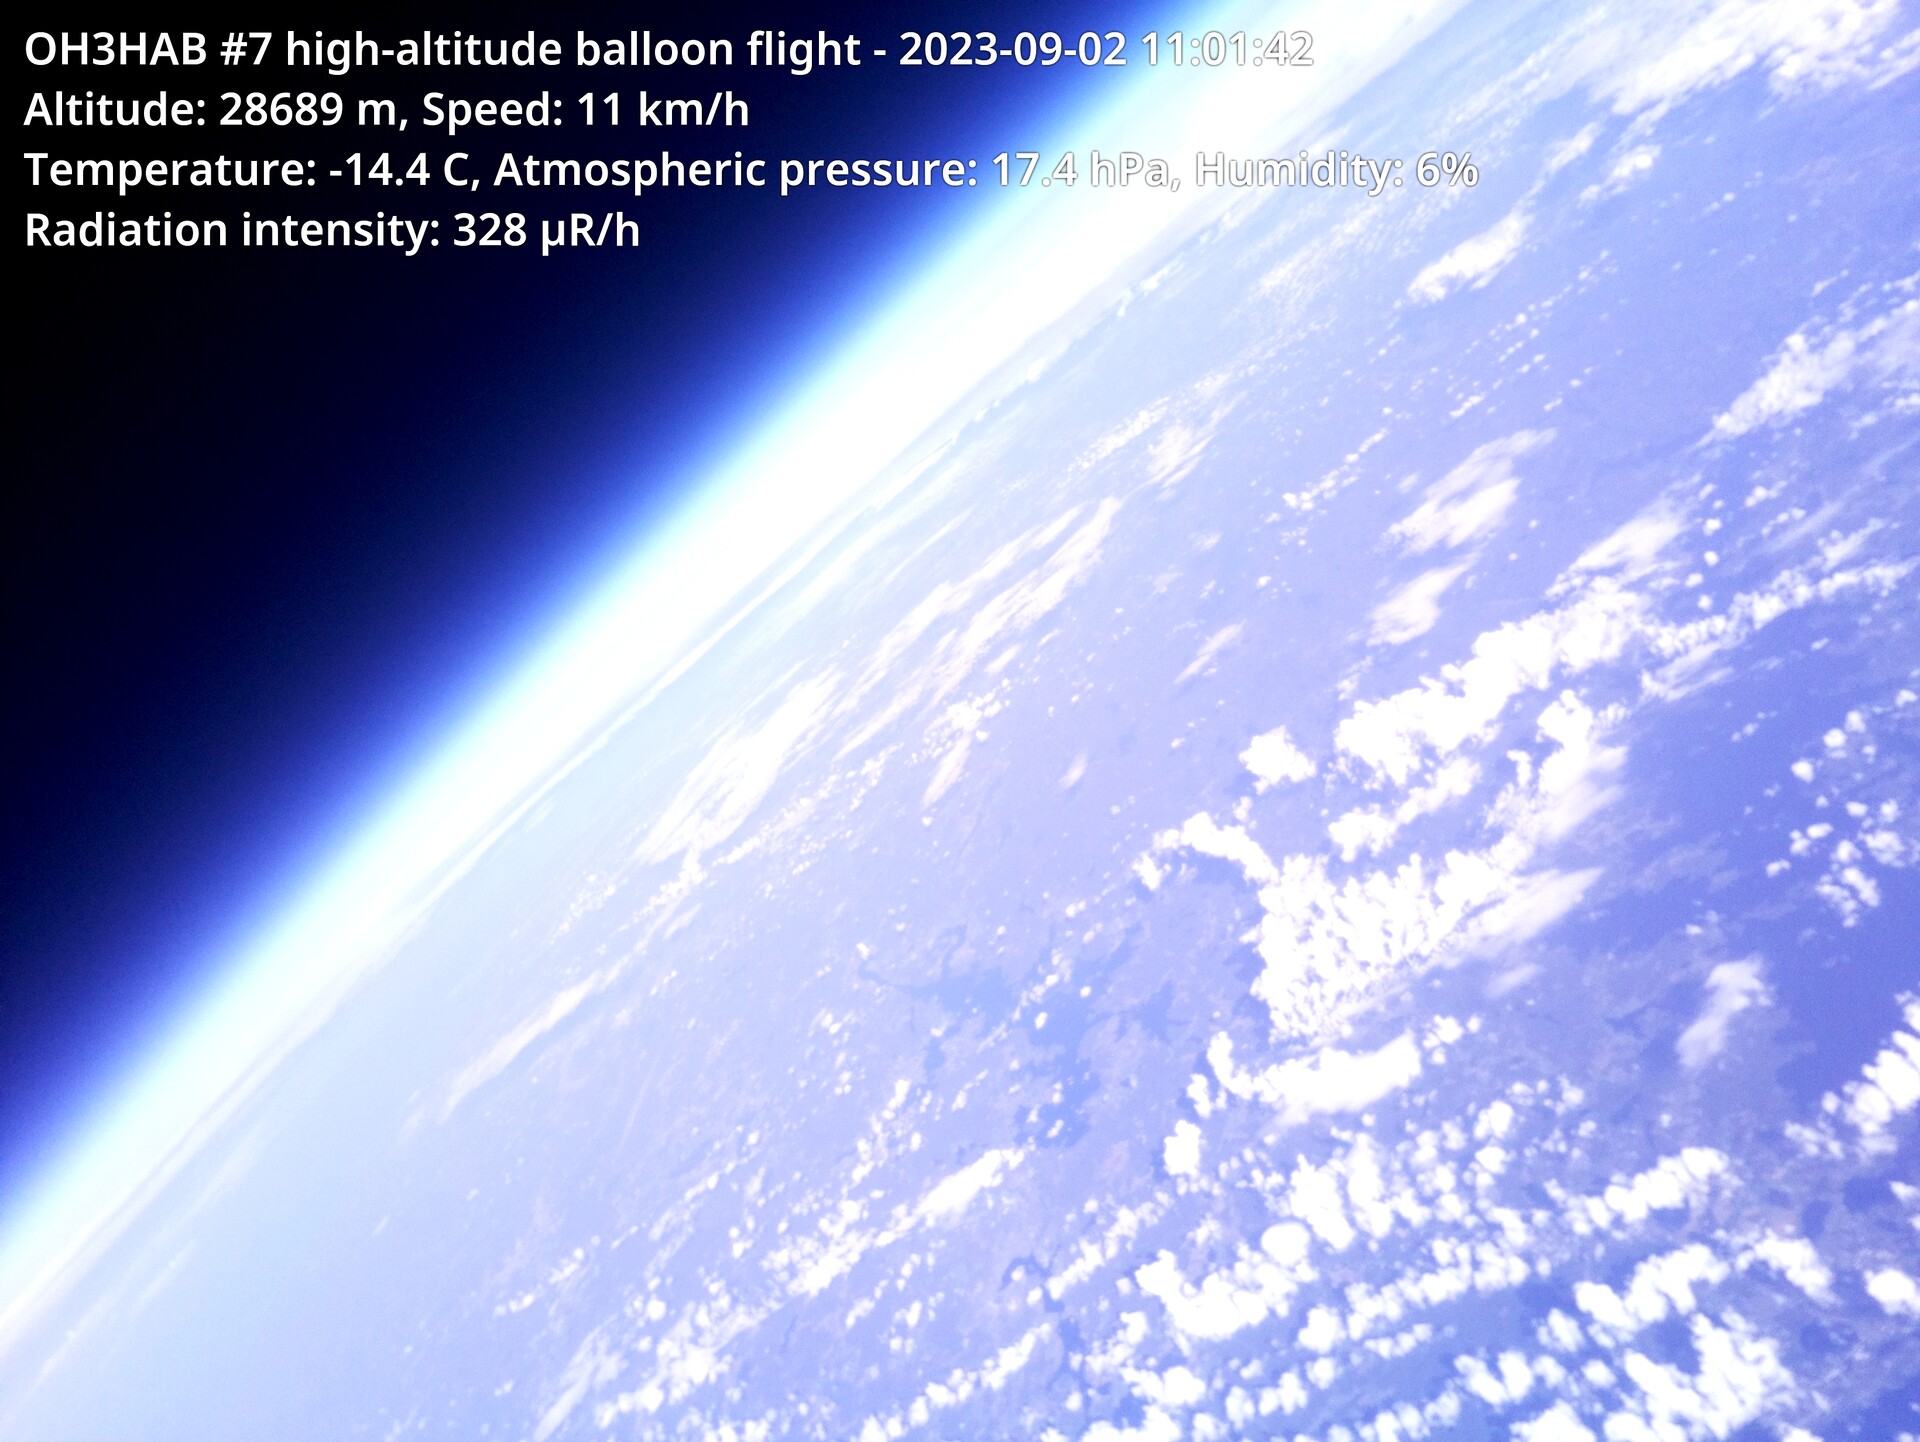
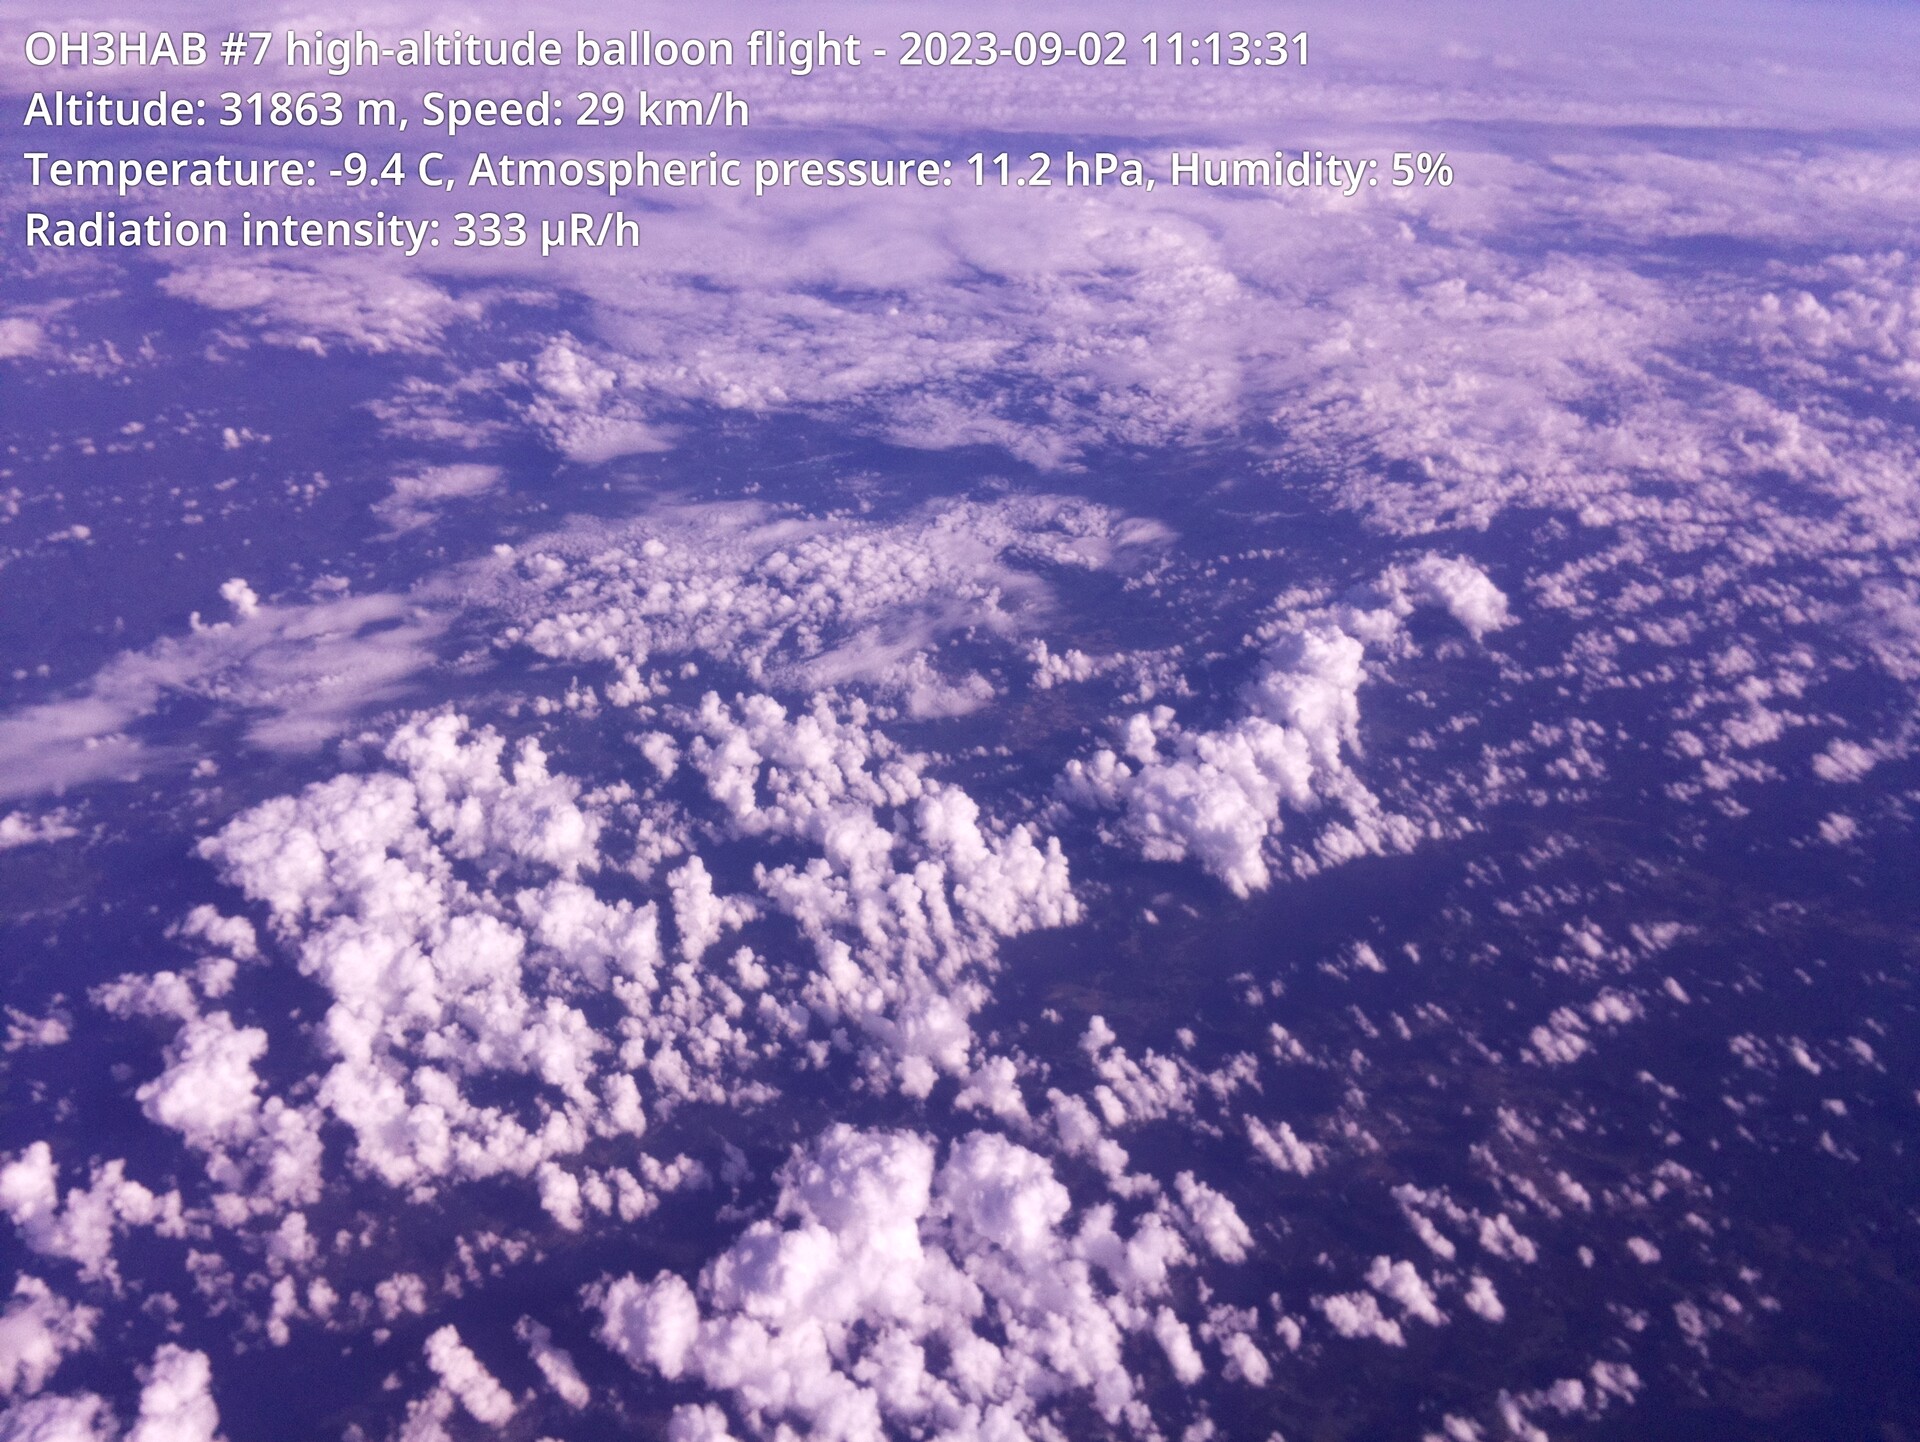
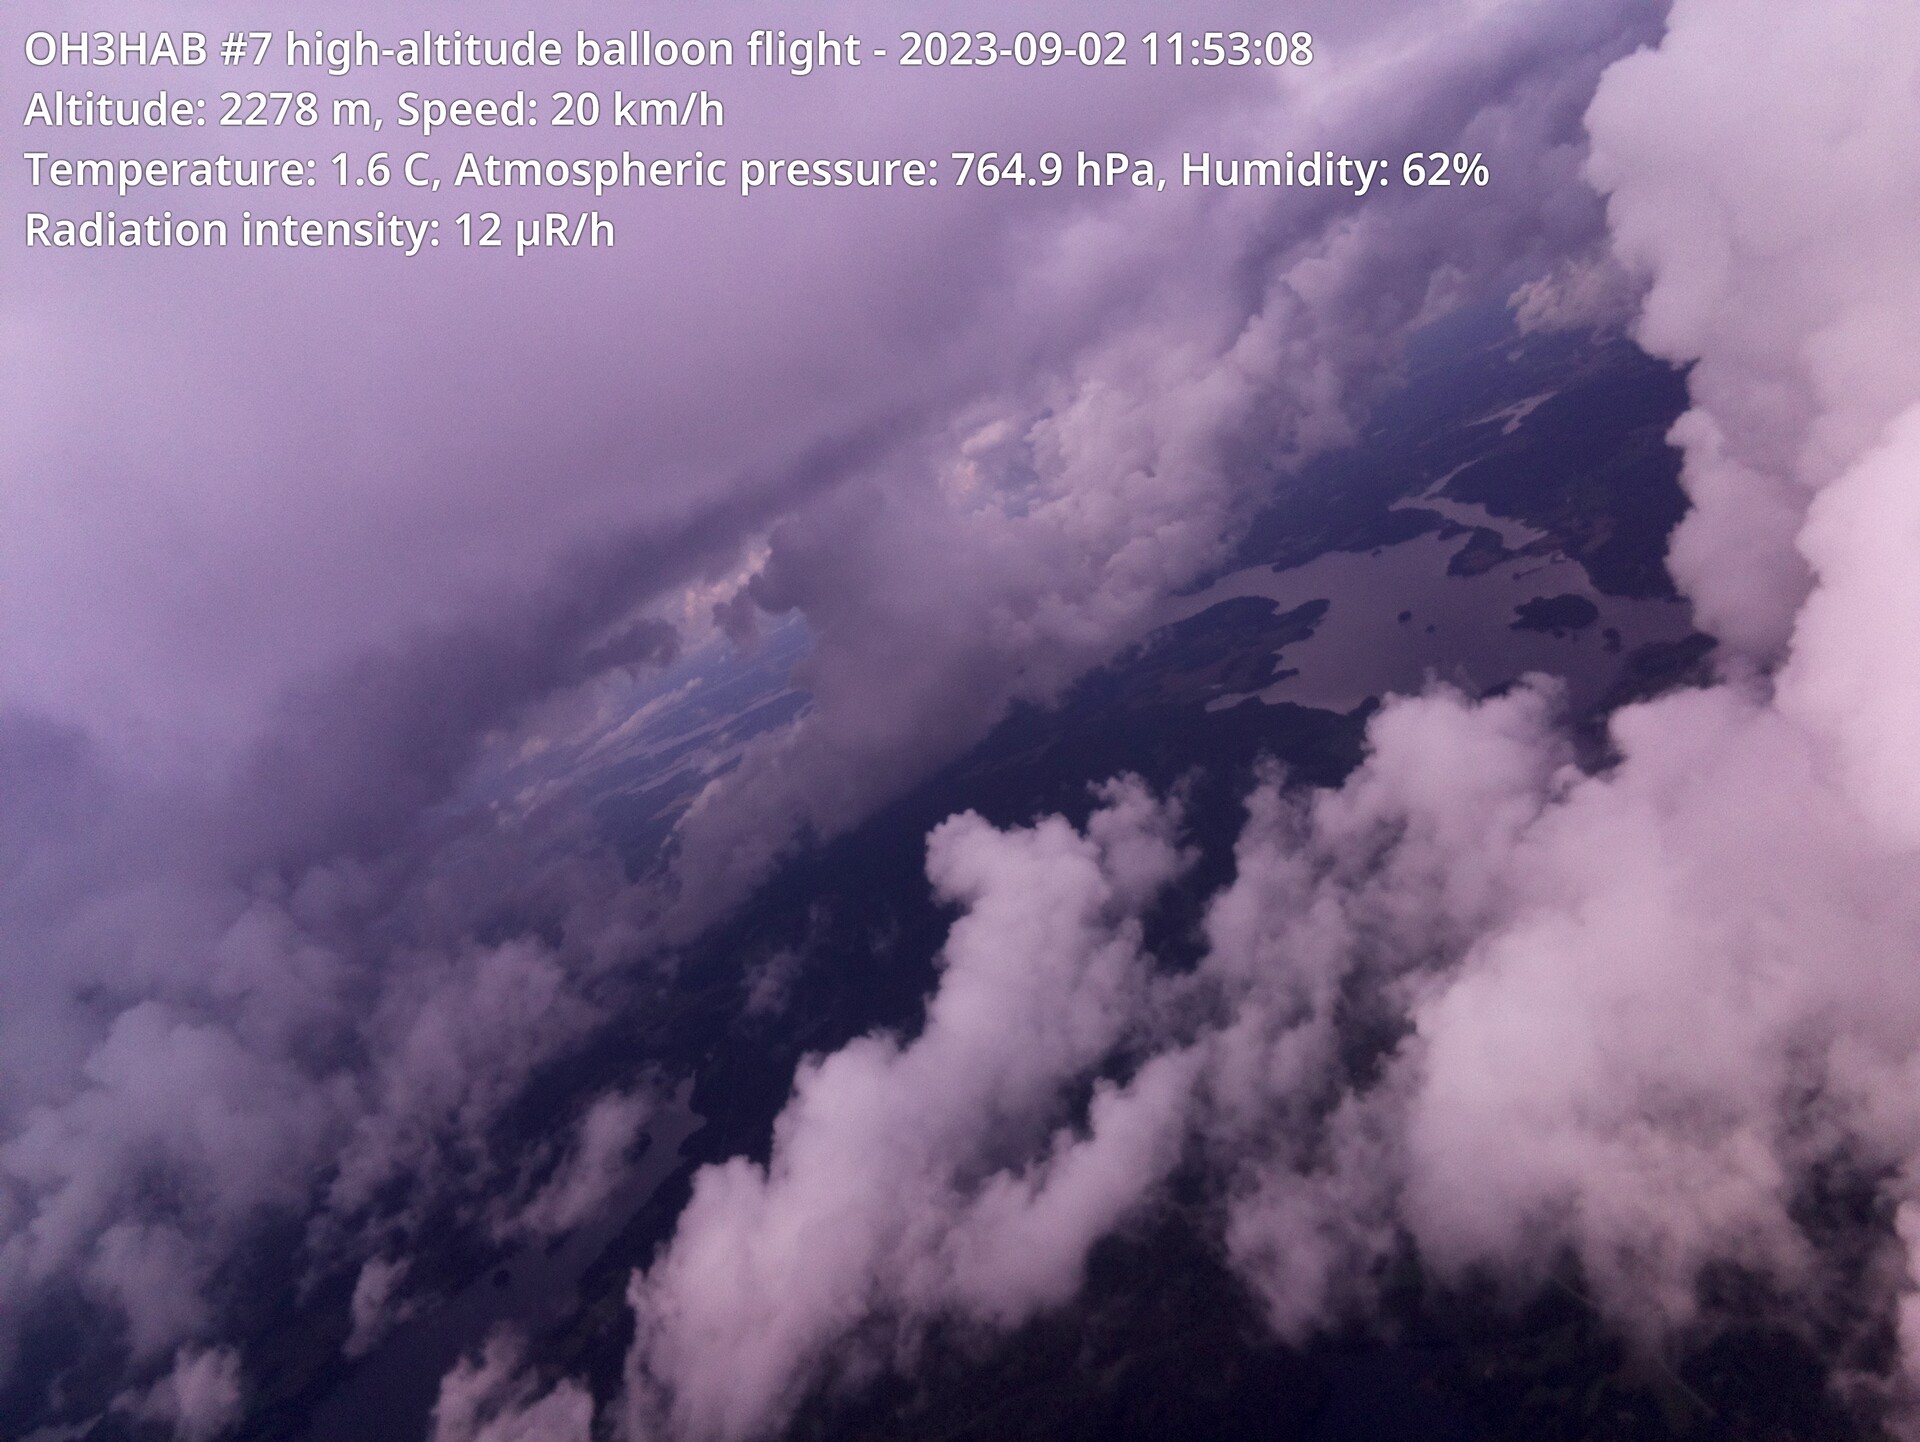
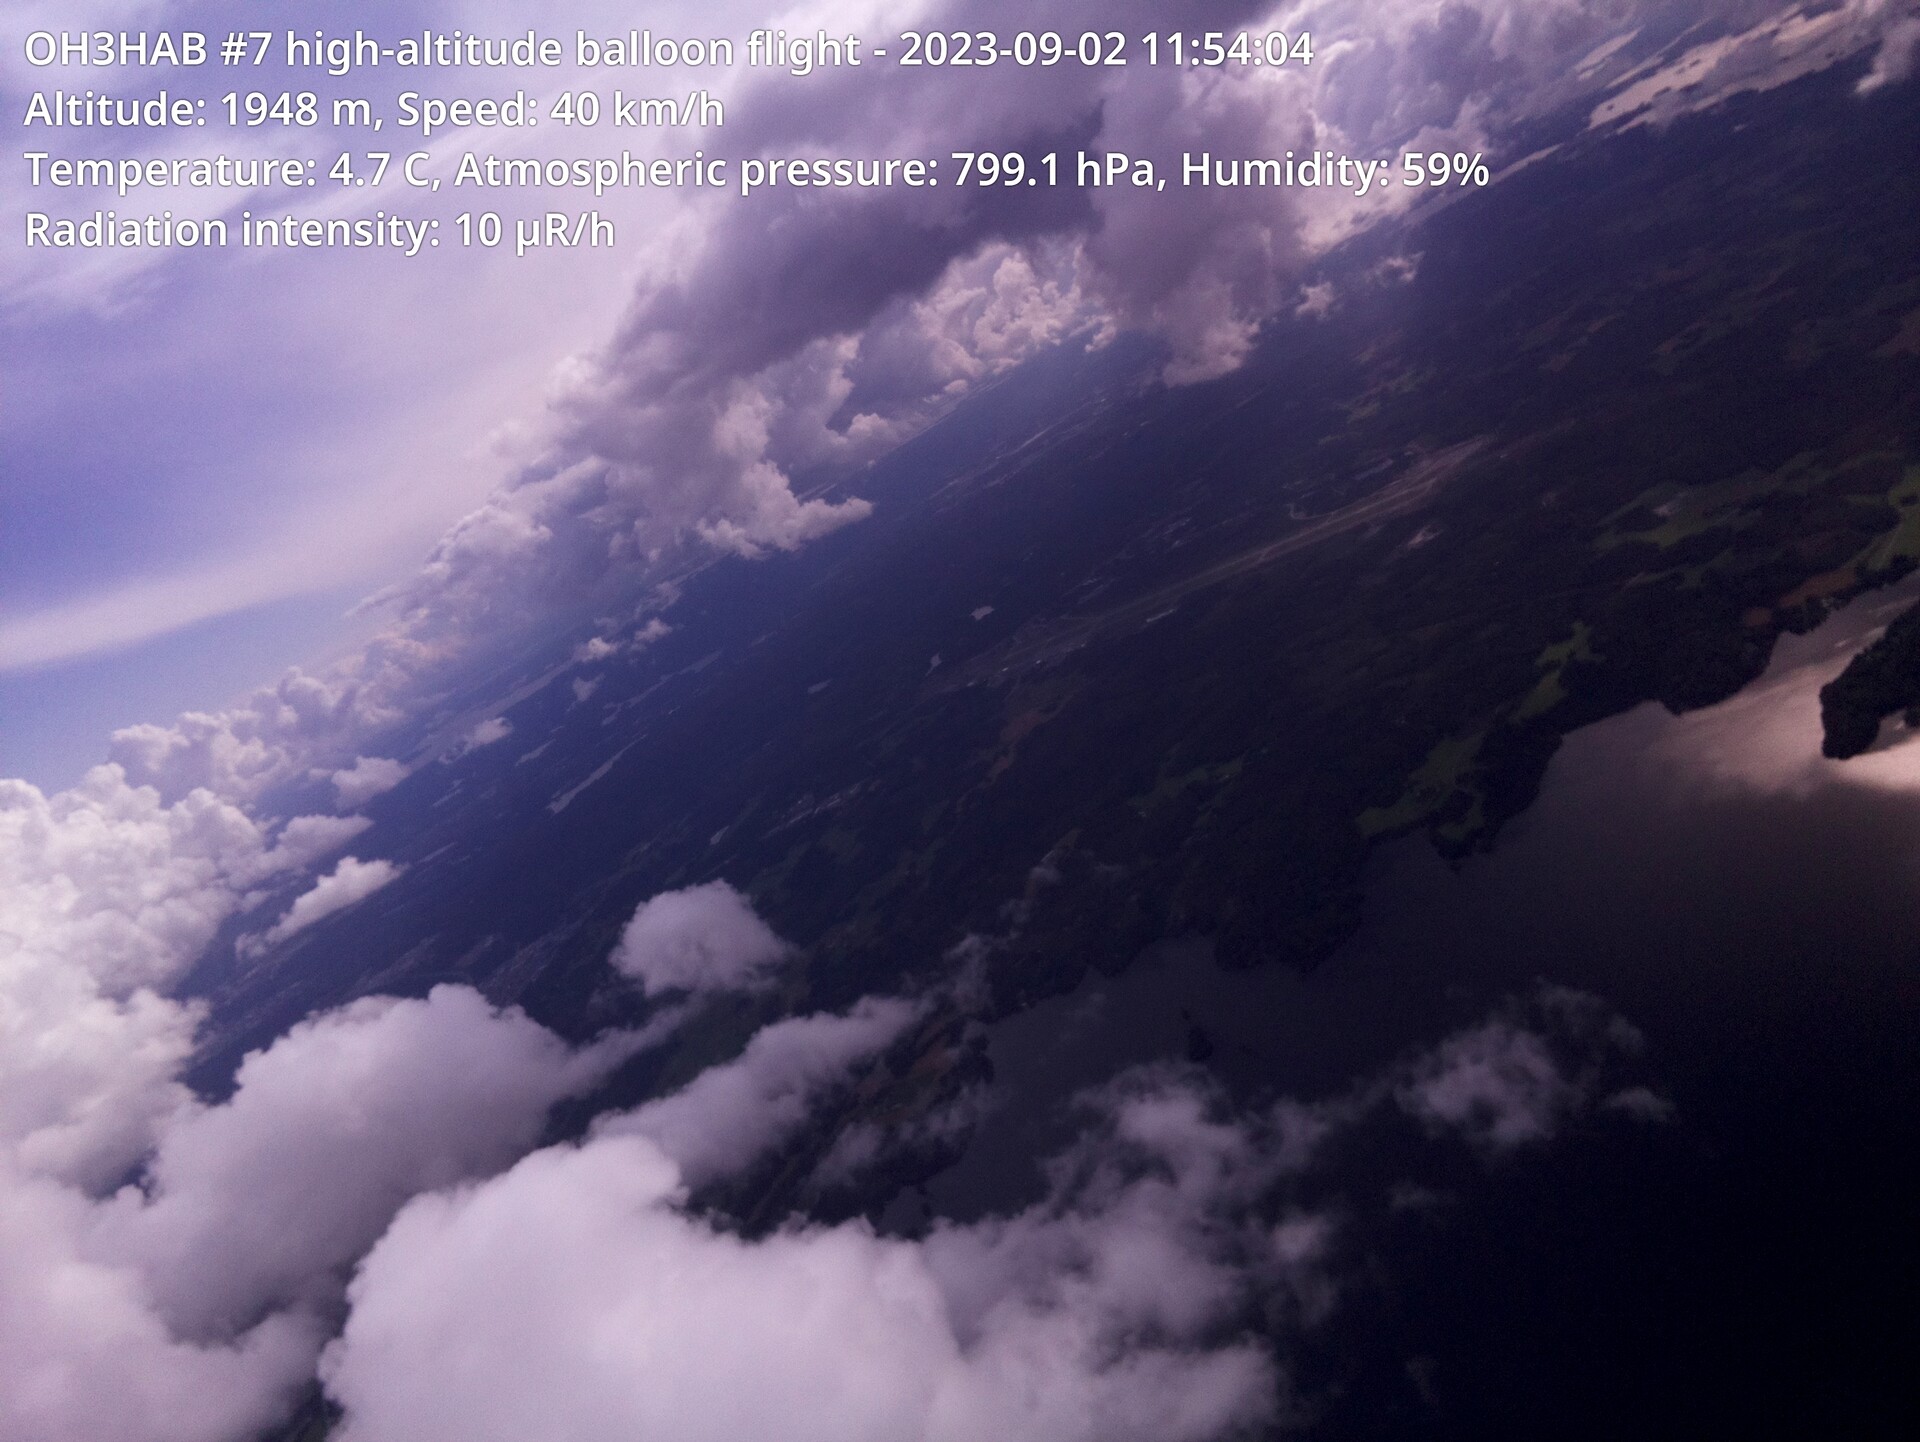
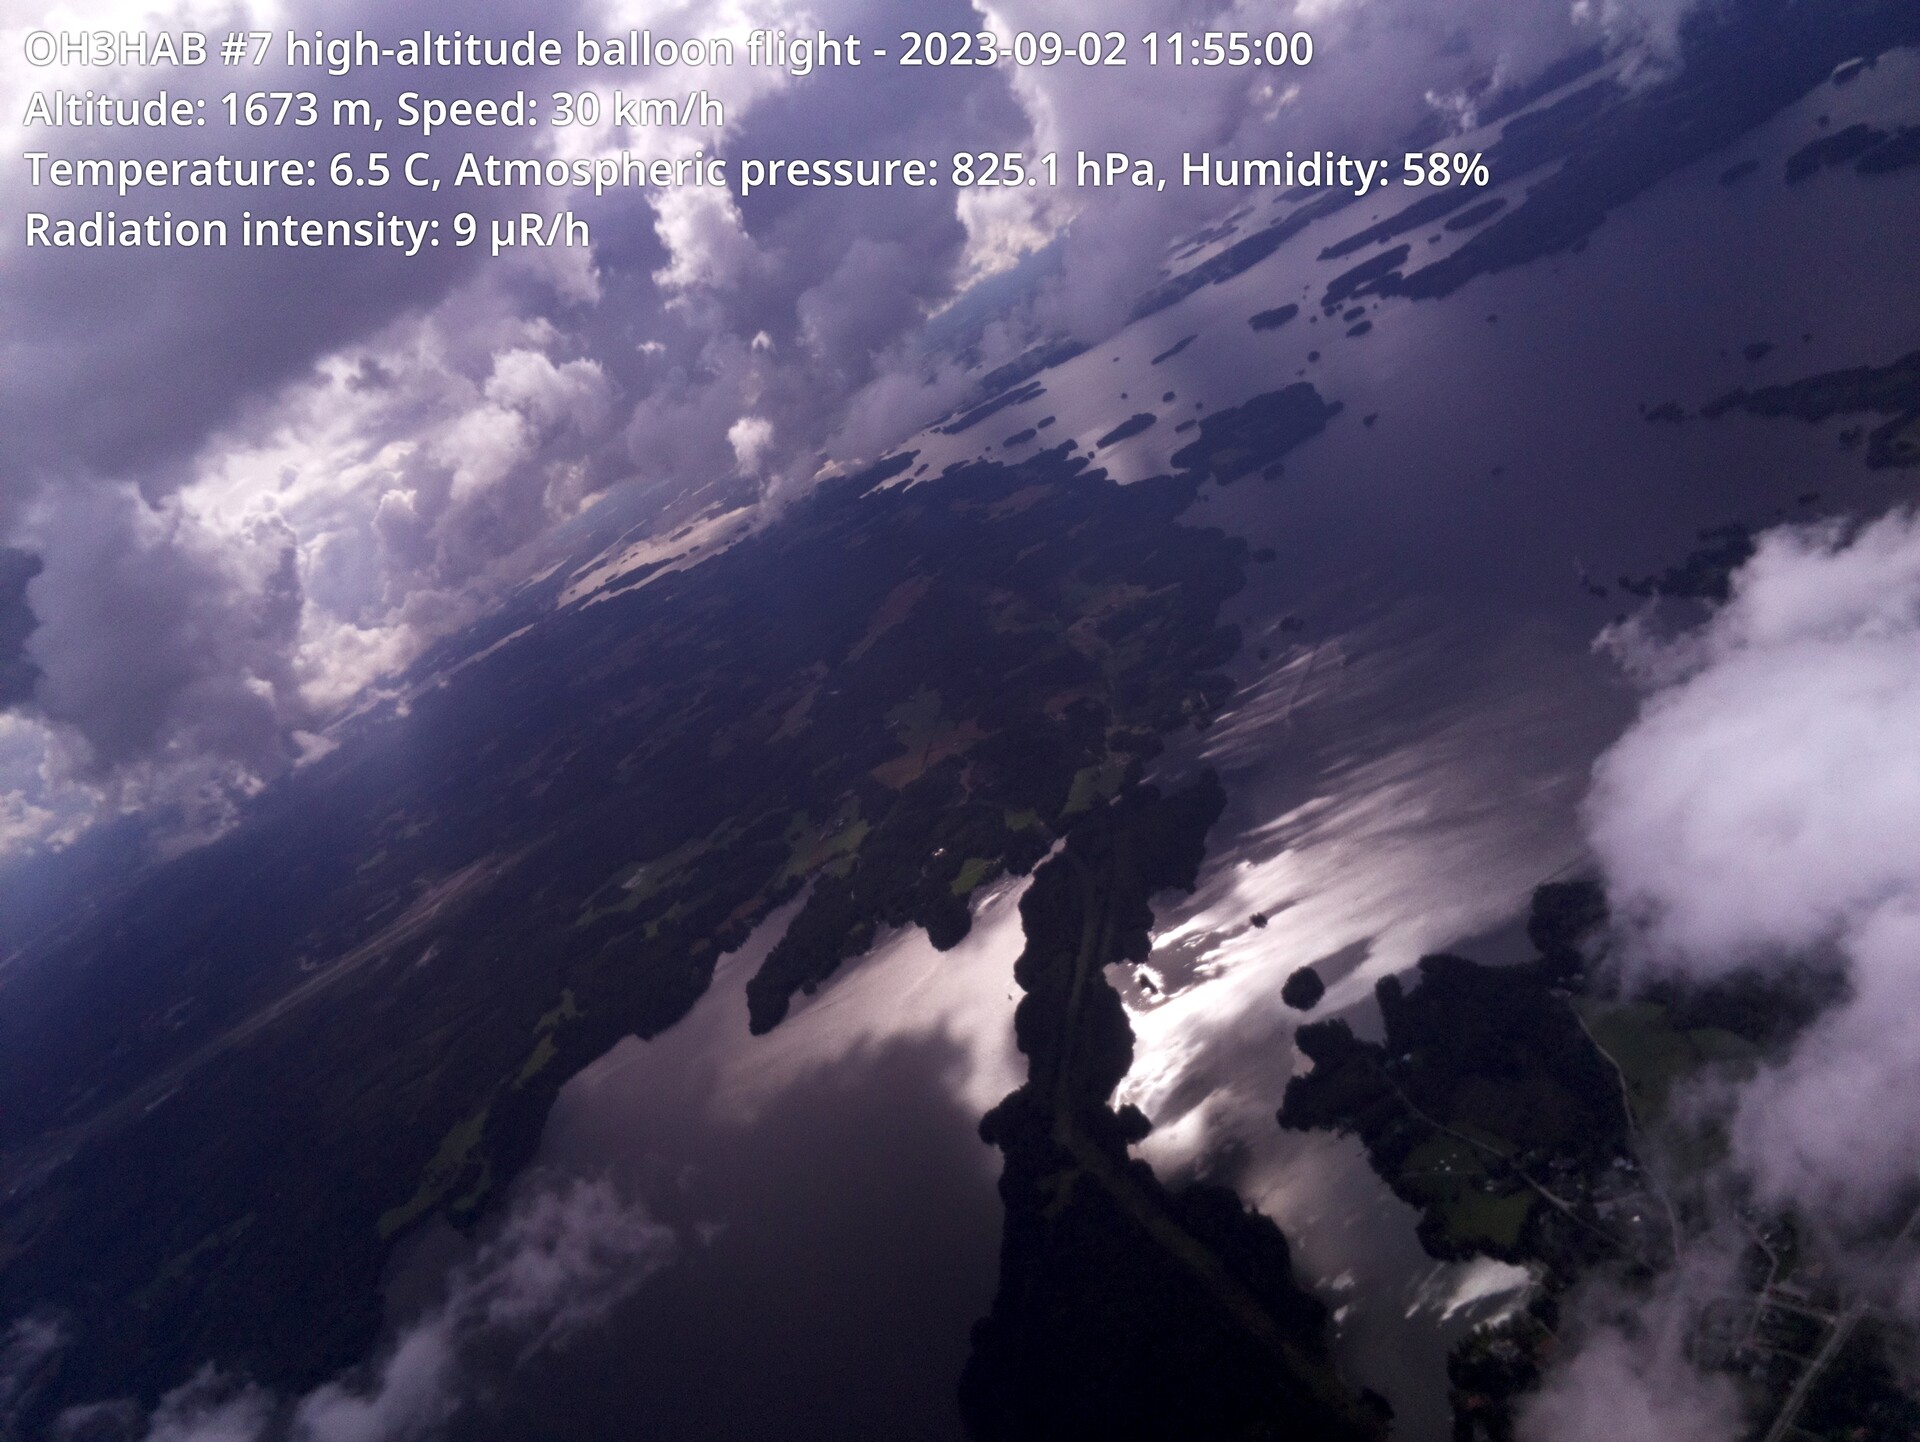
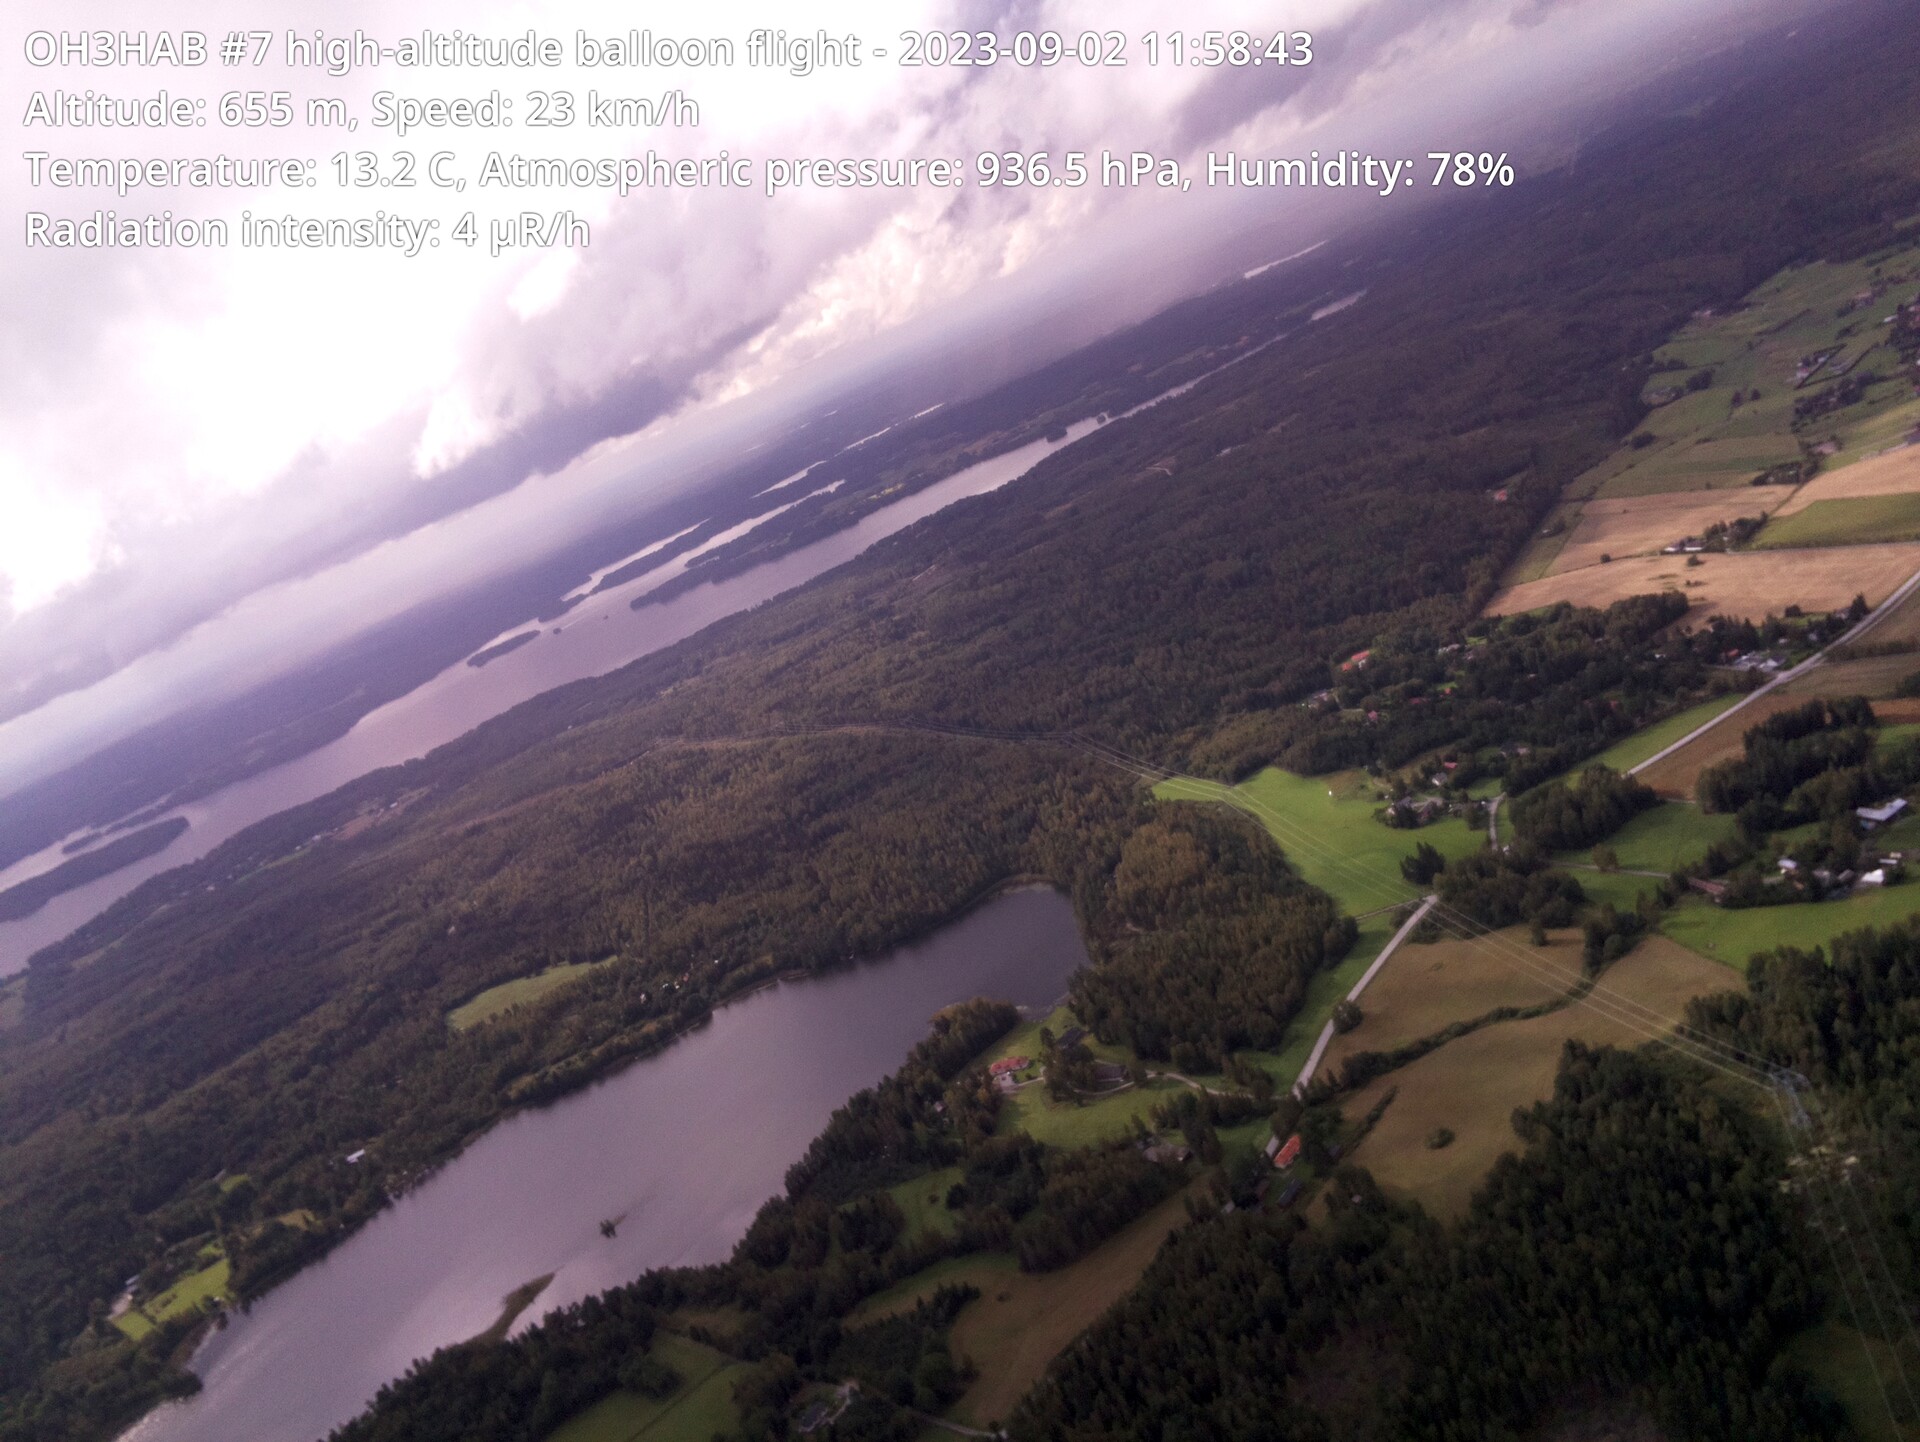
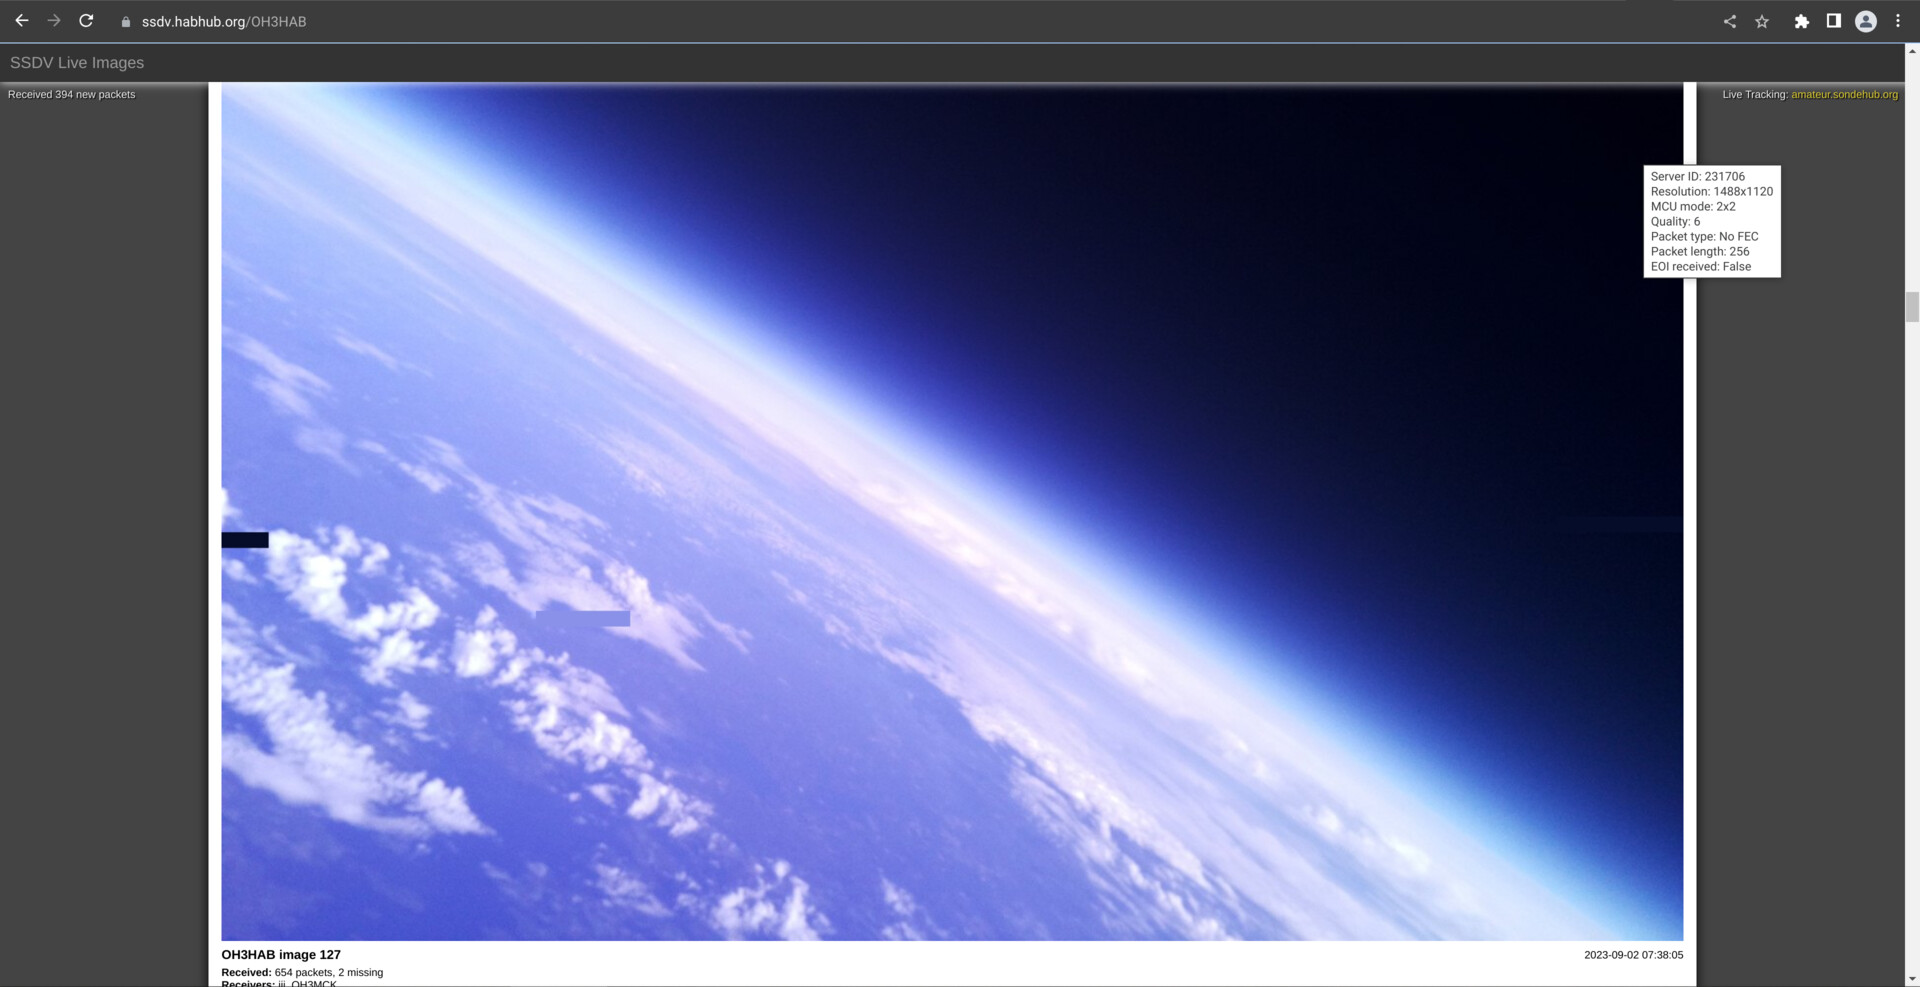
Photos from the flight
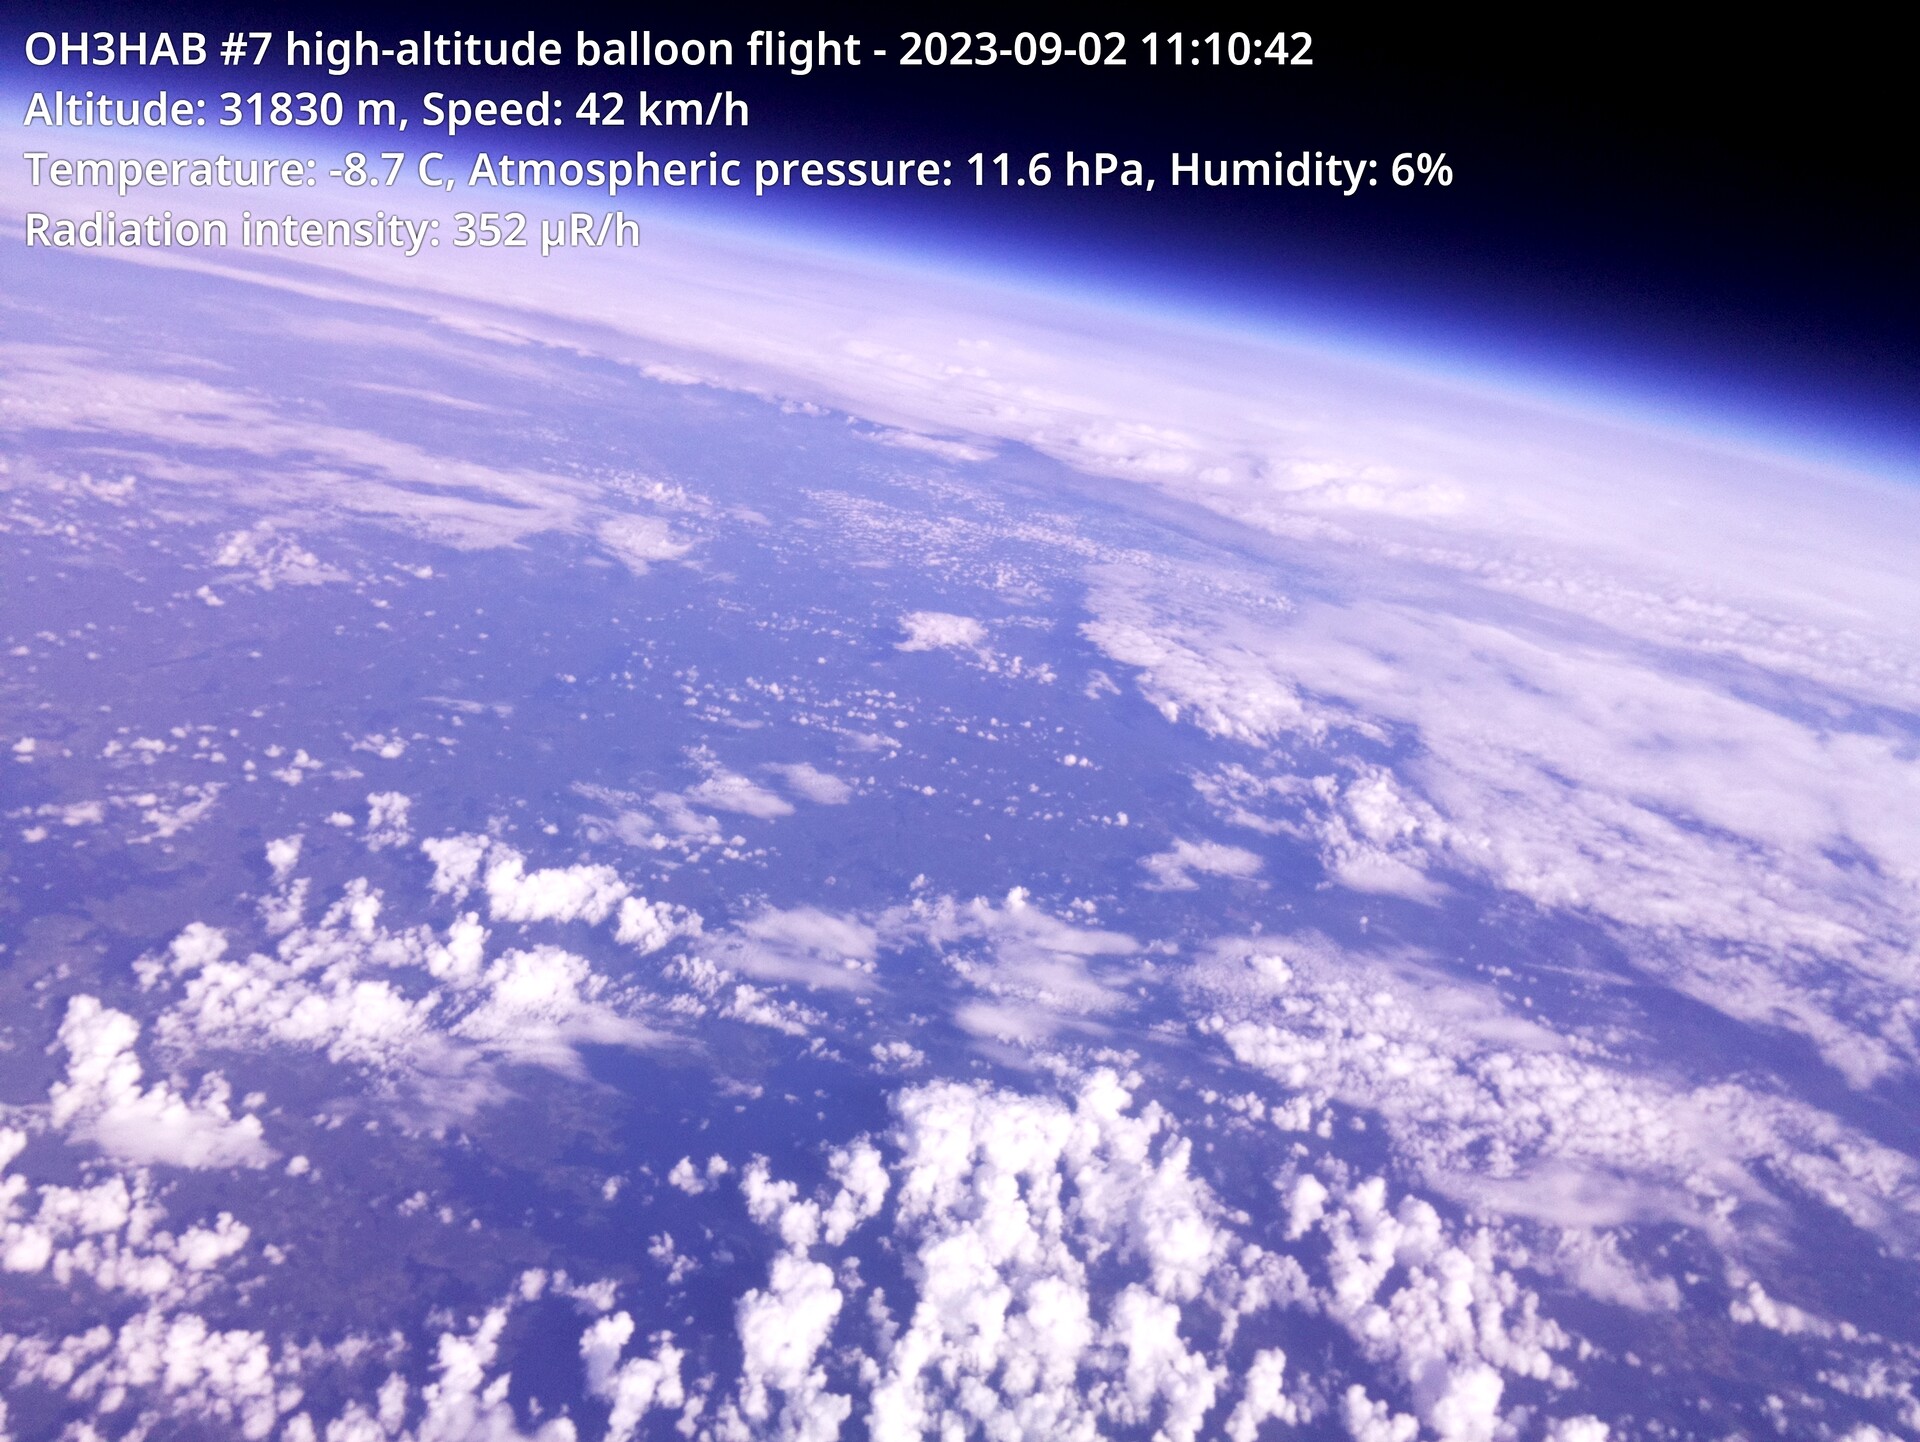
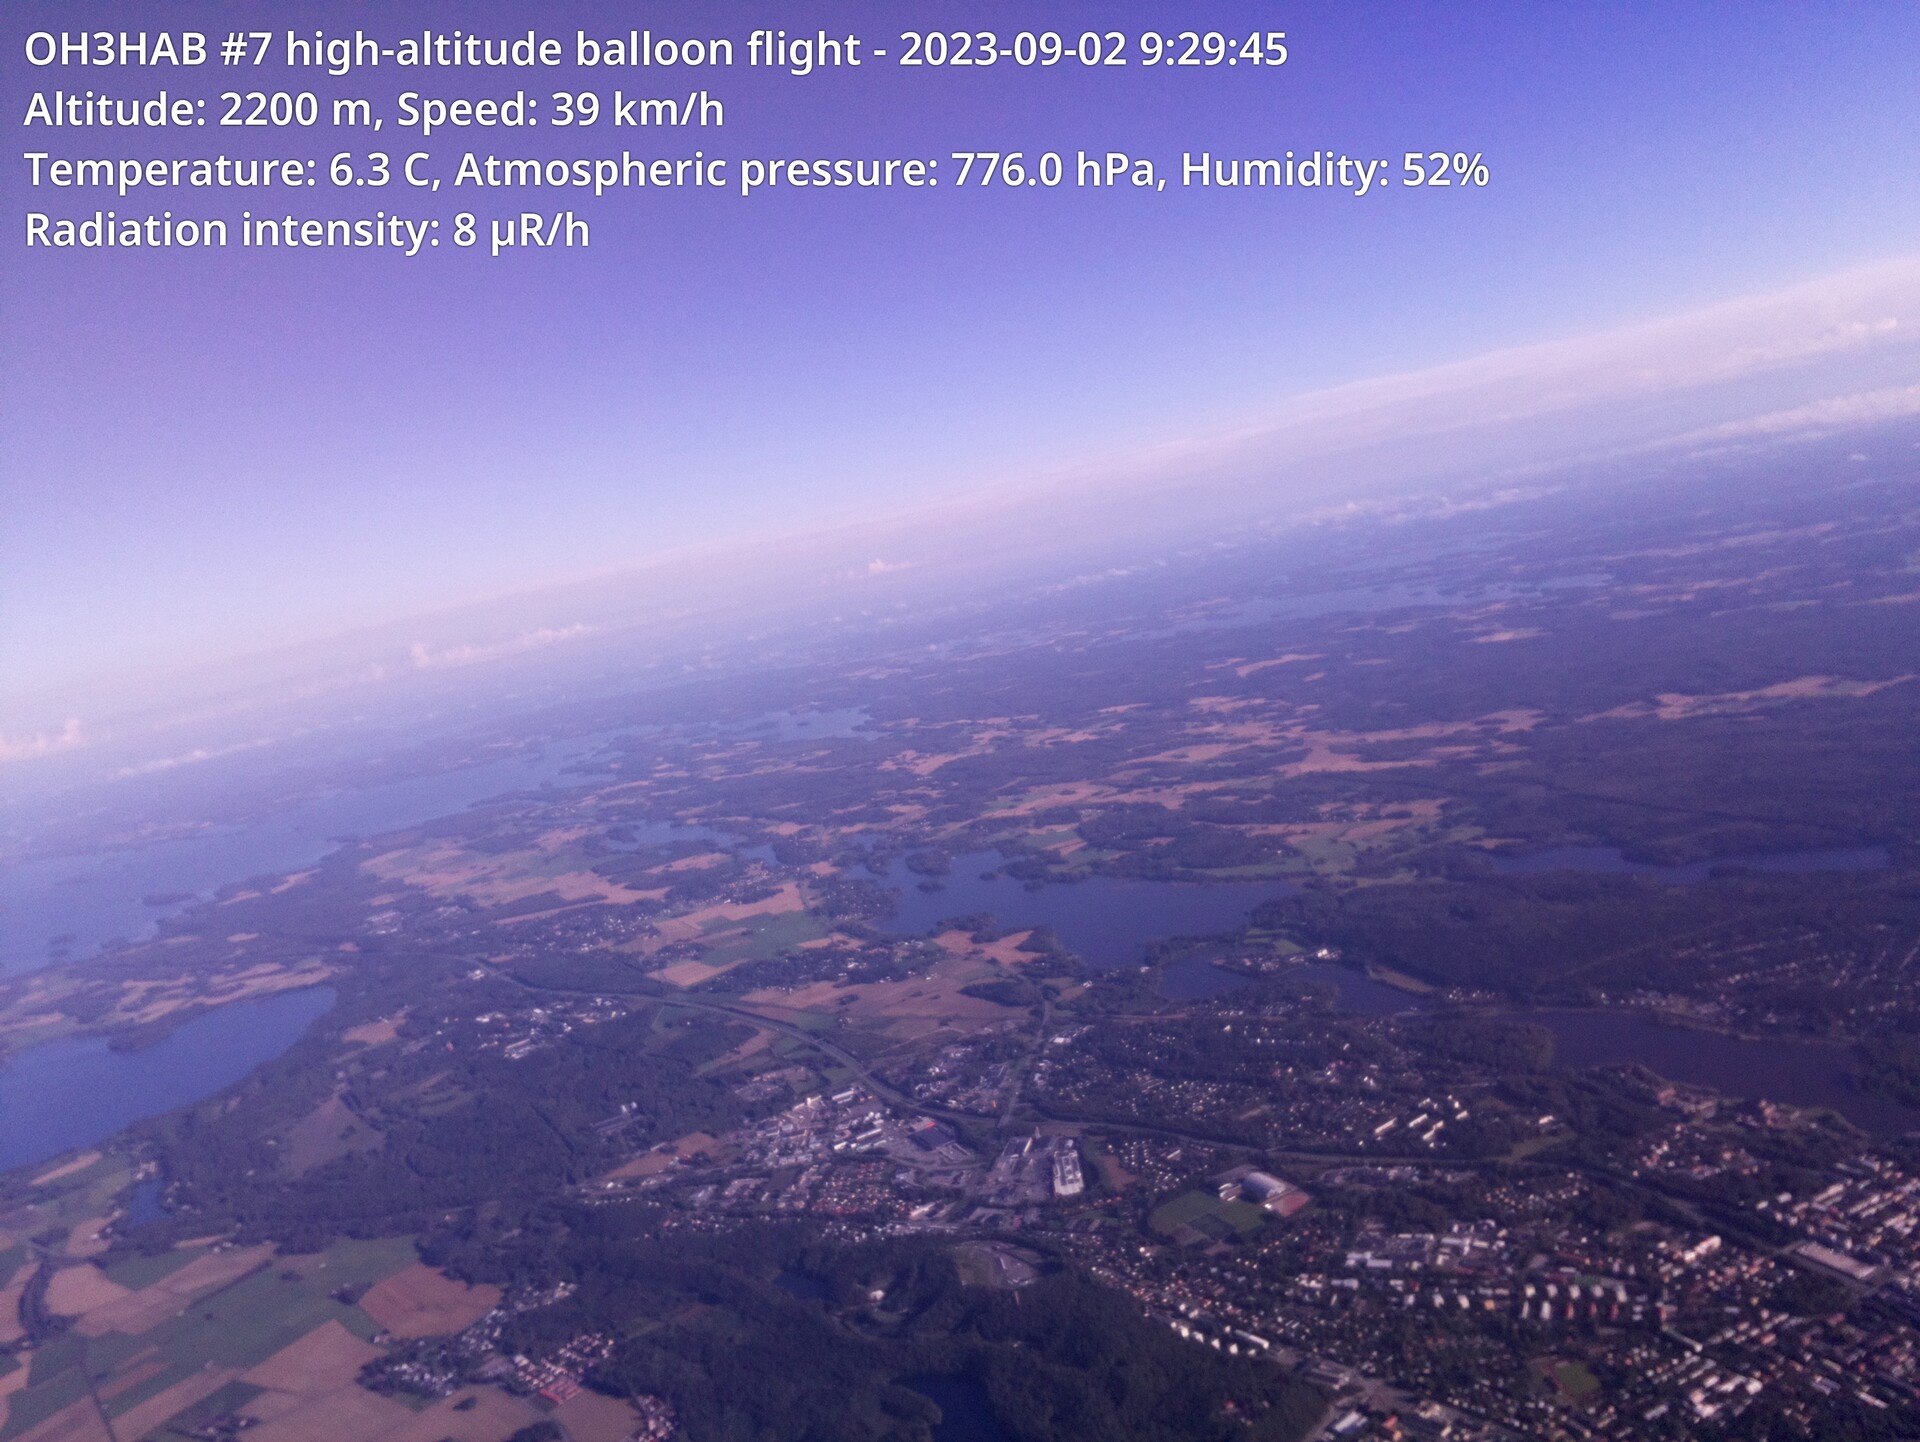
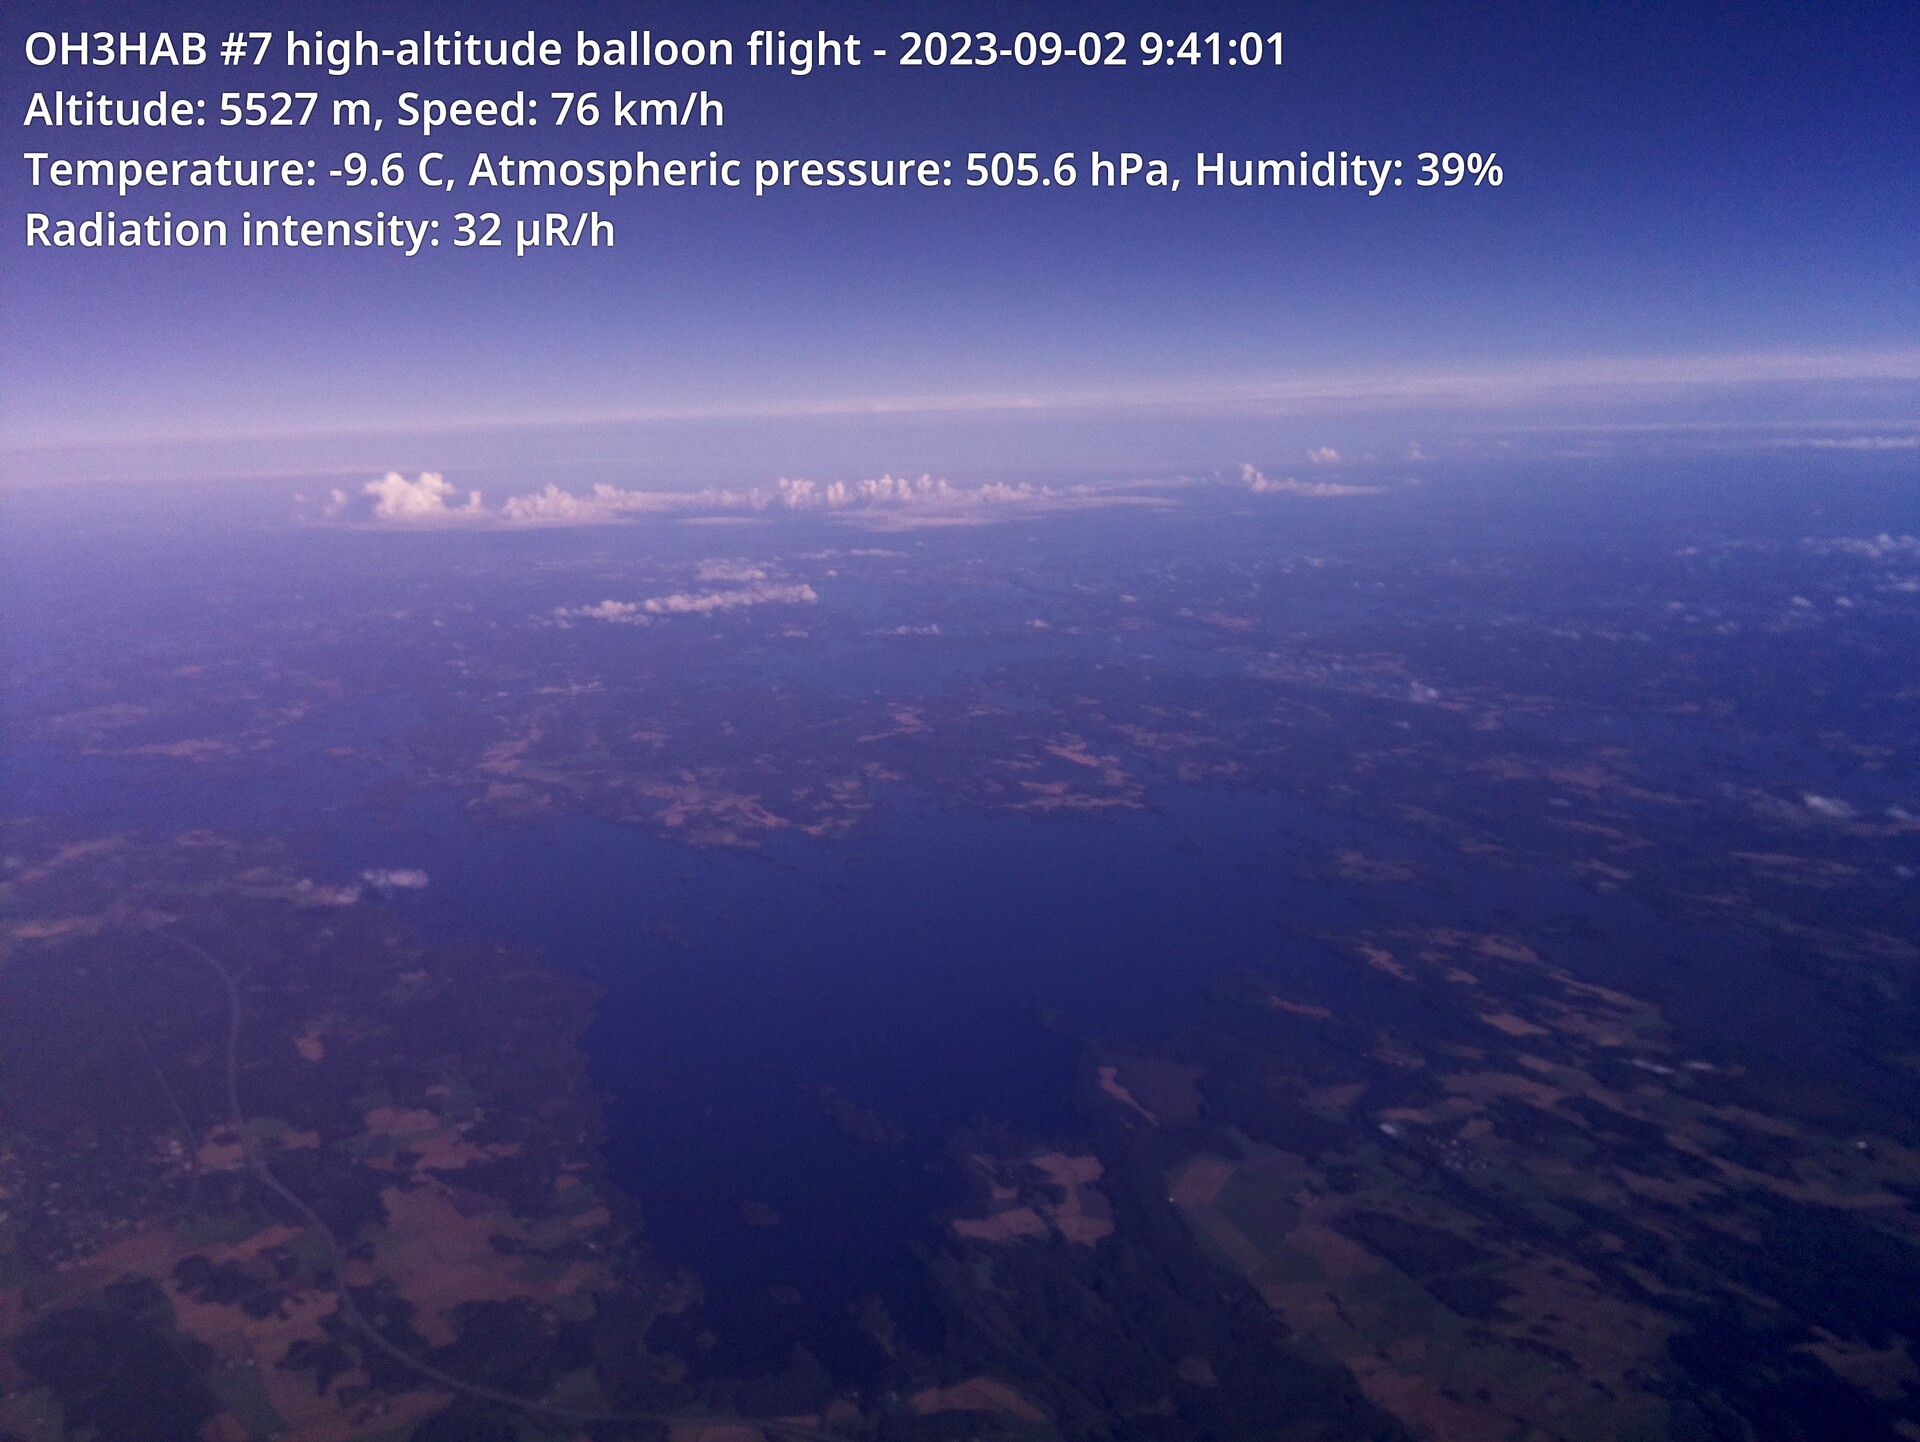
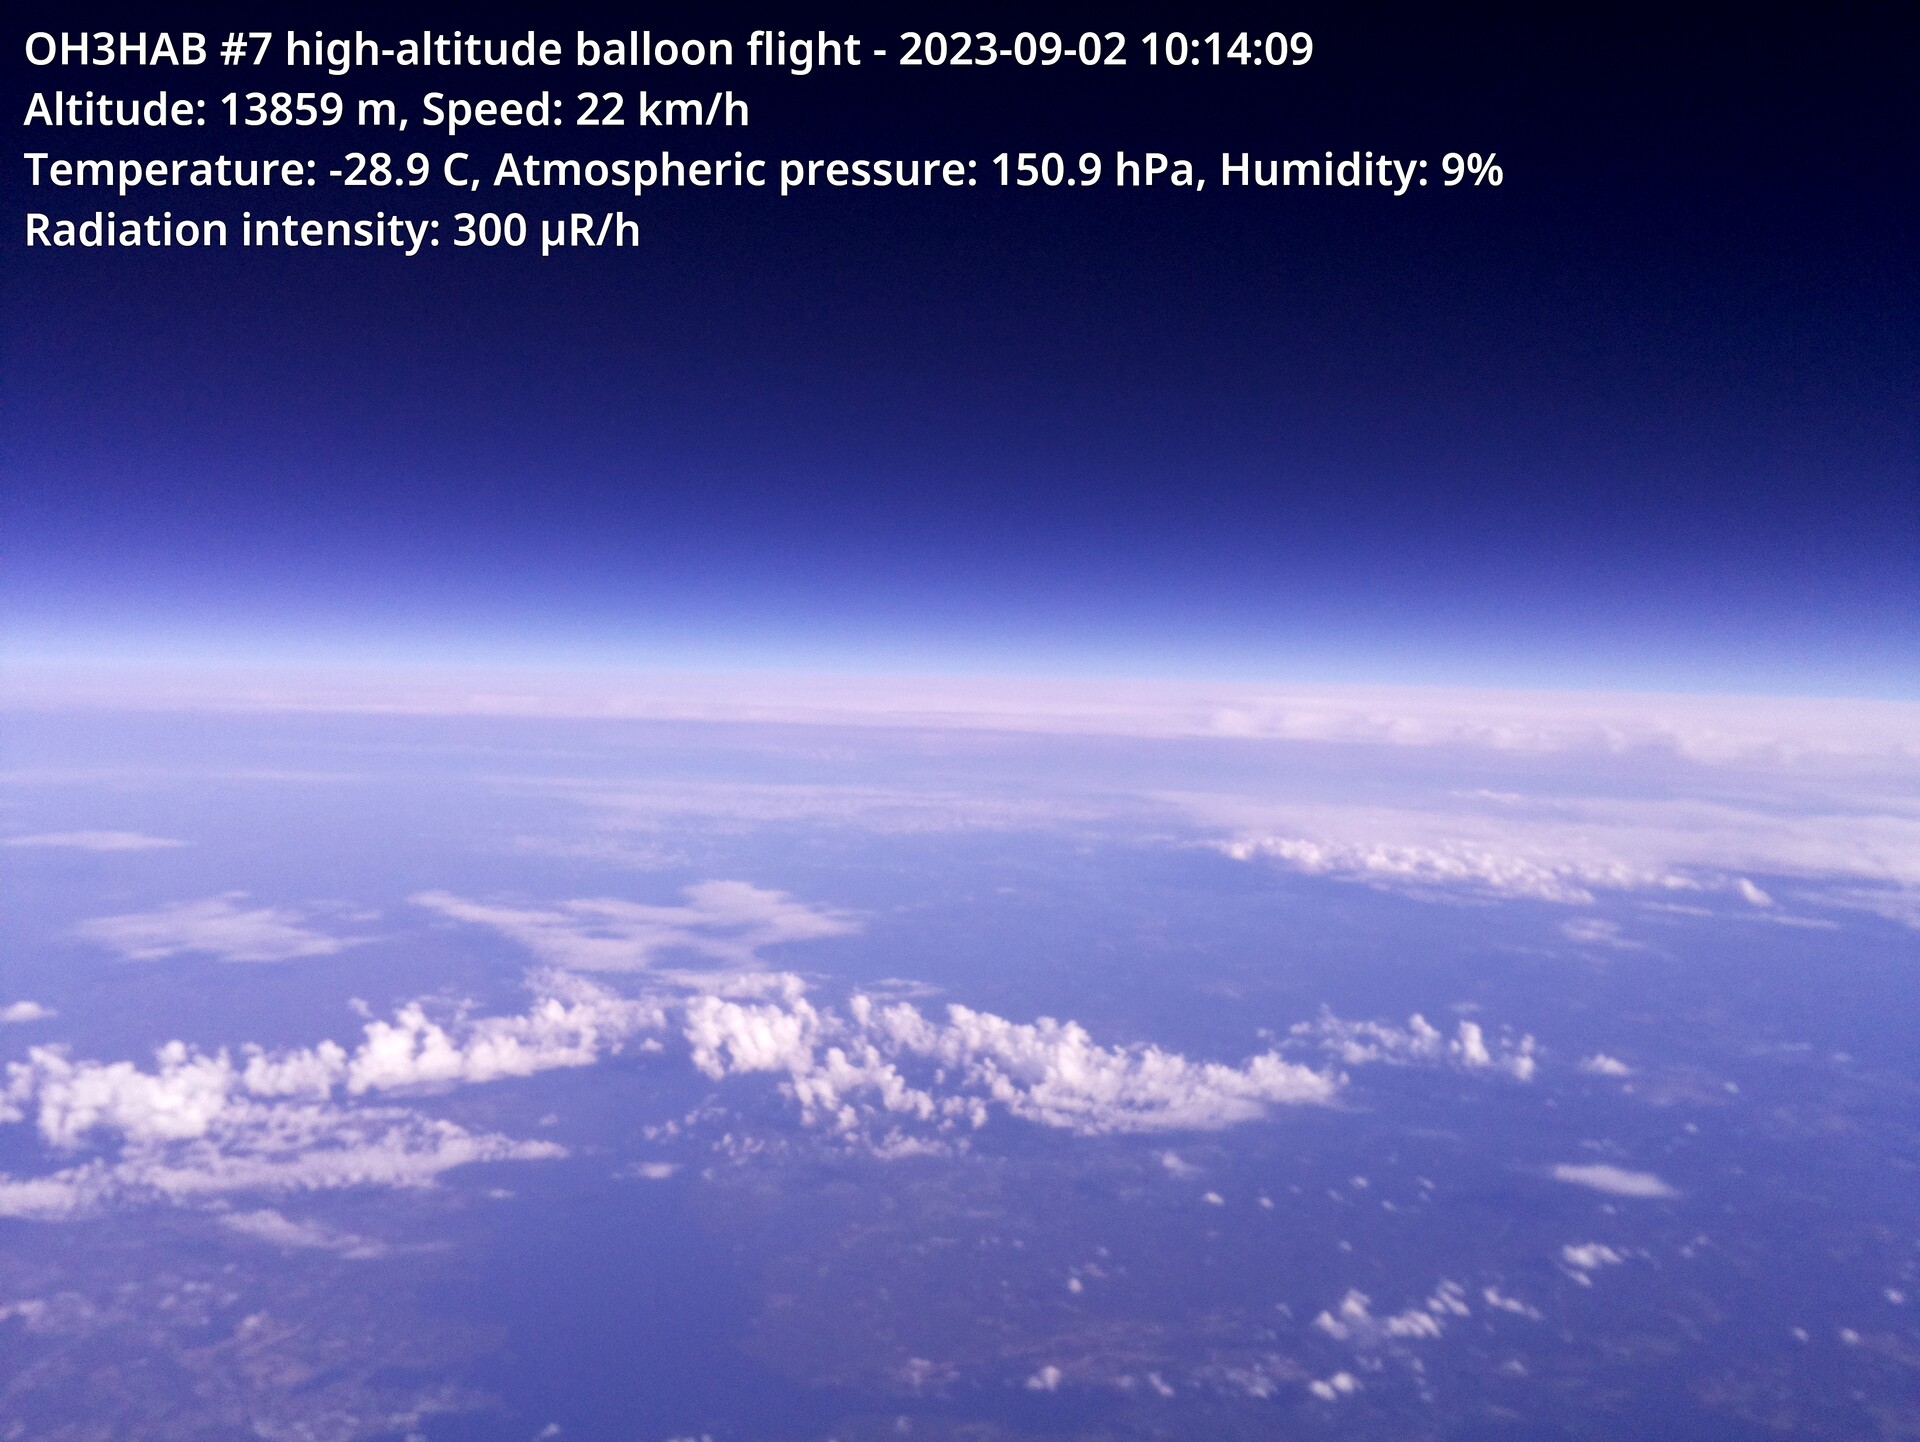
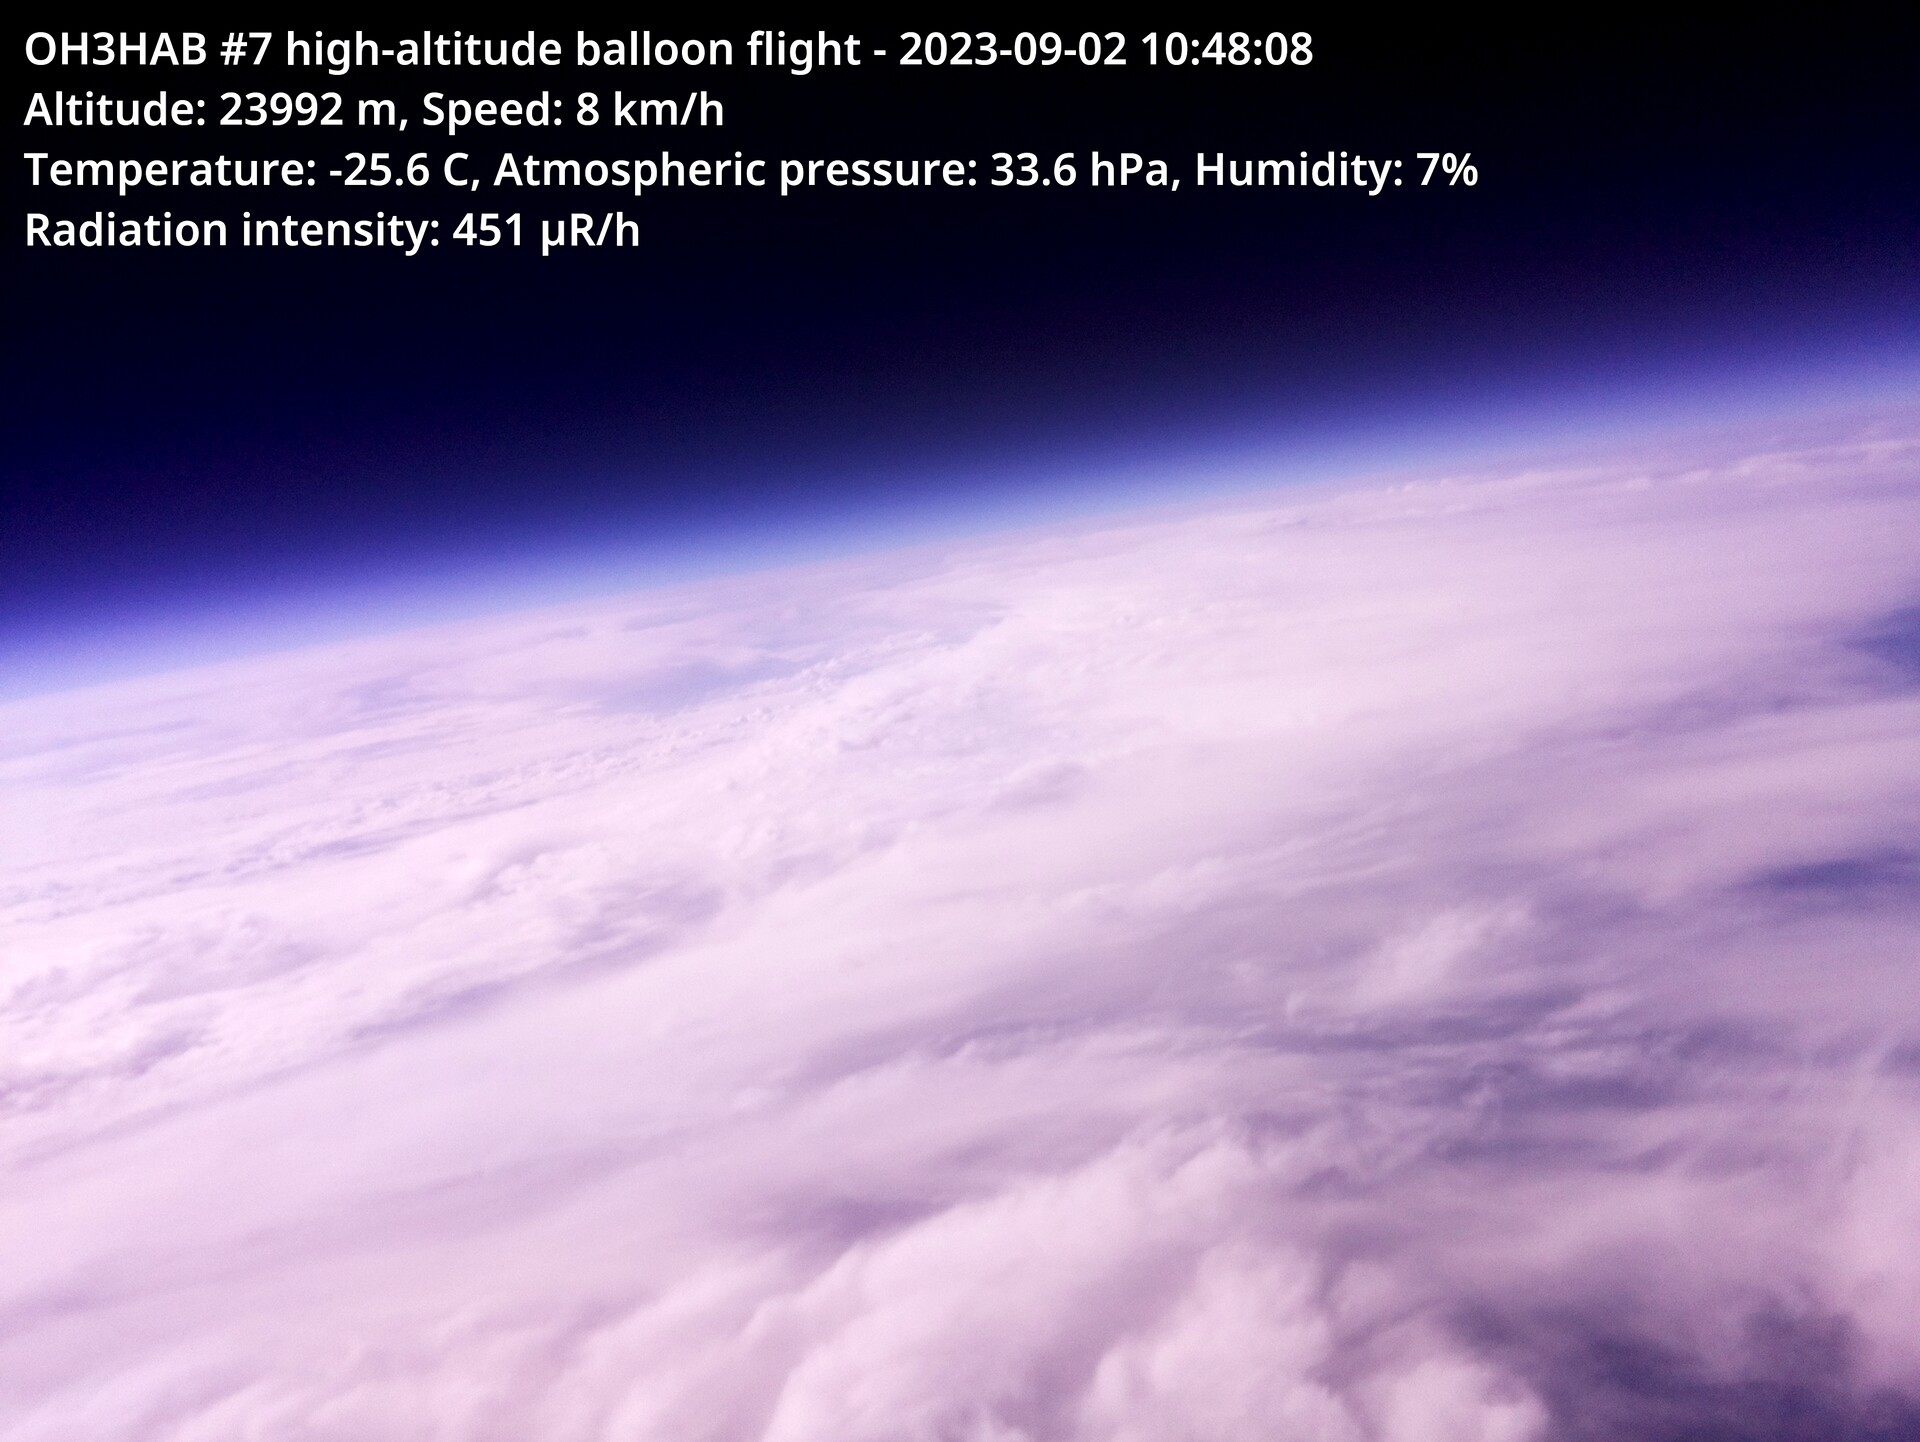
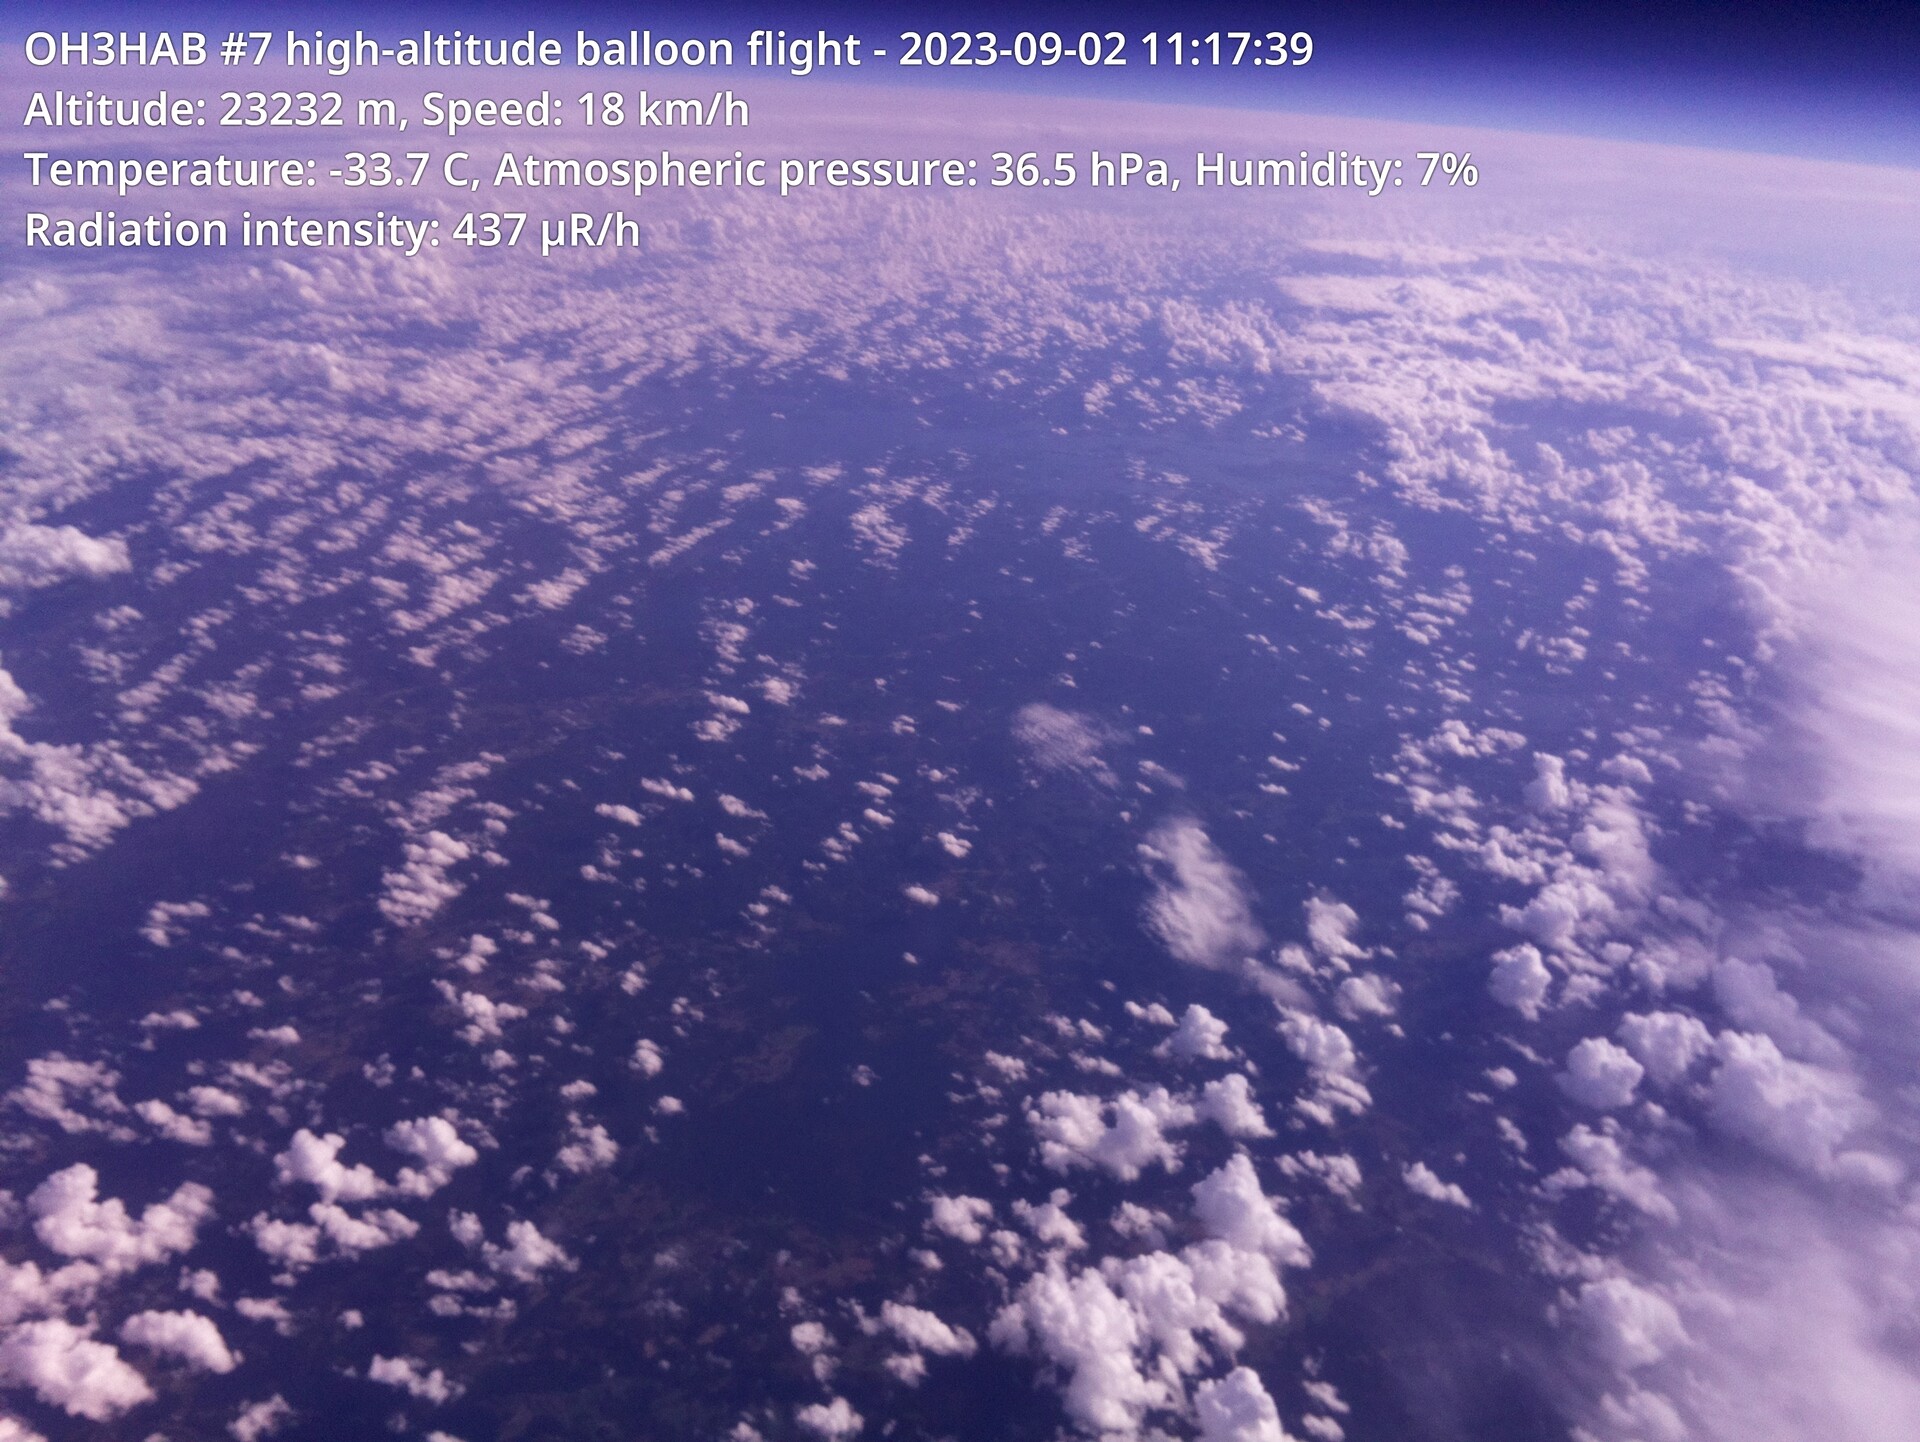
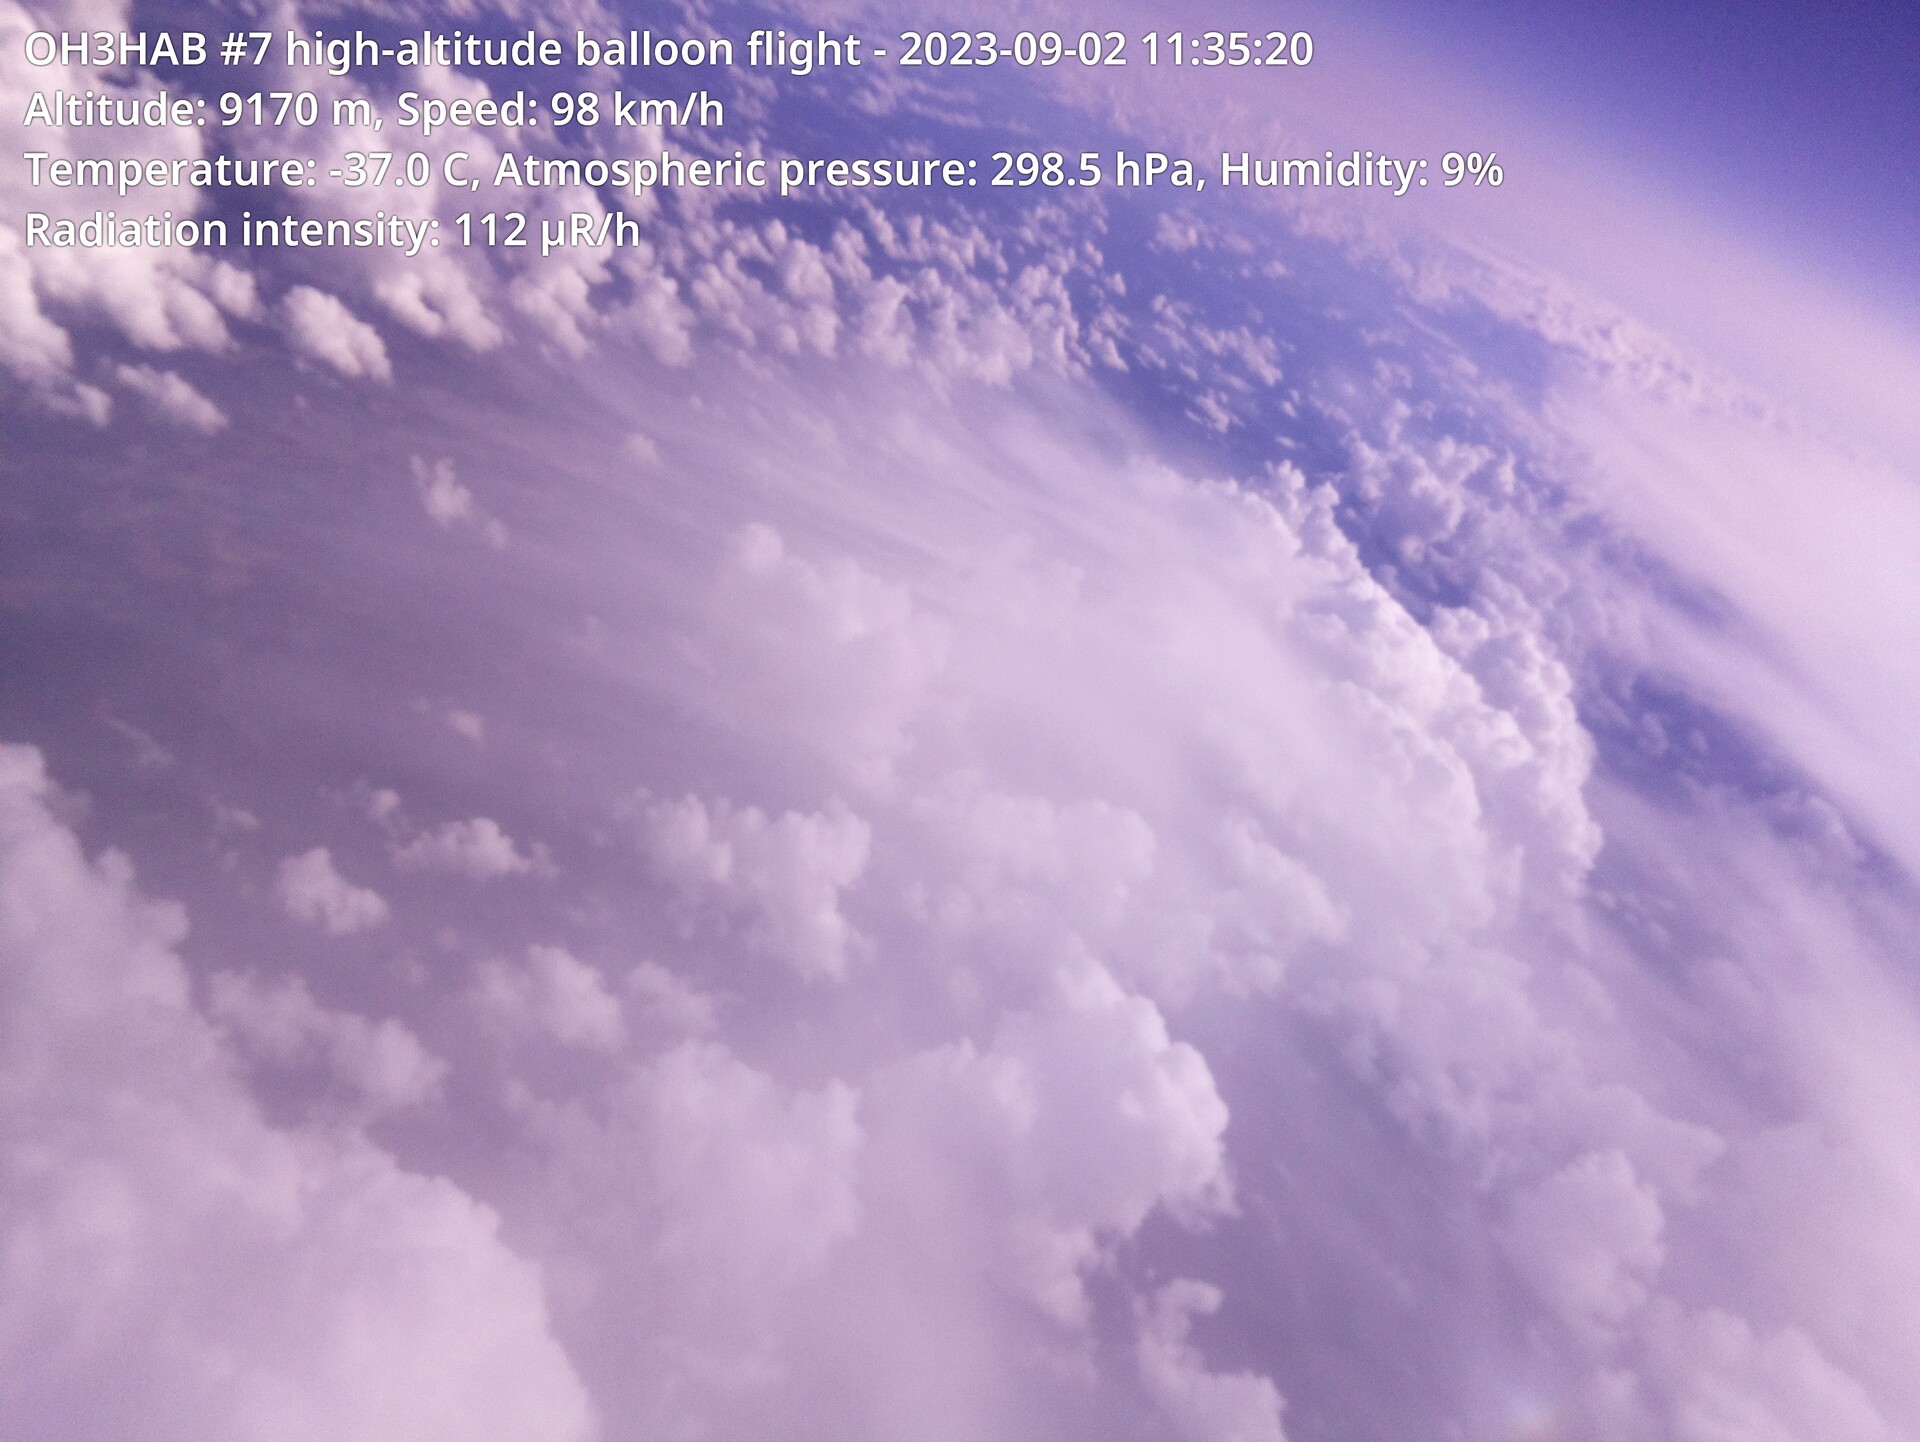
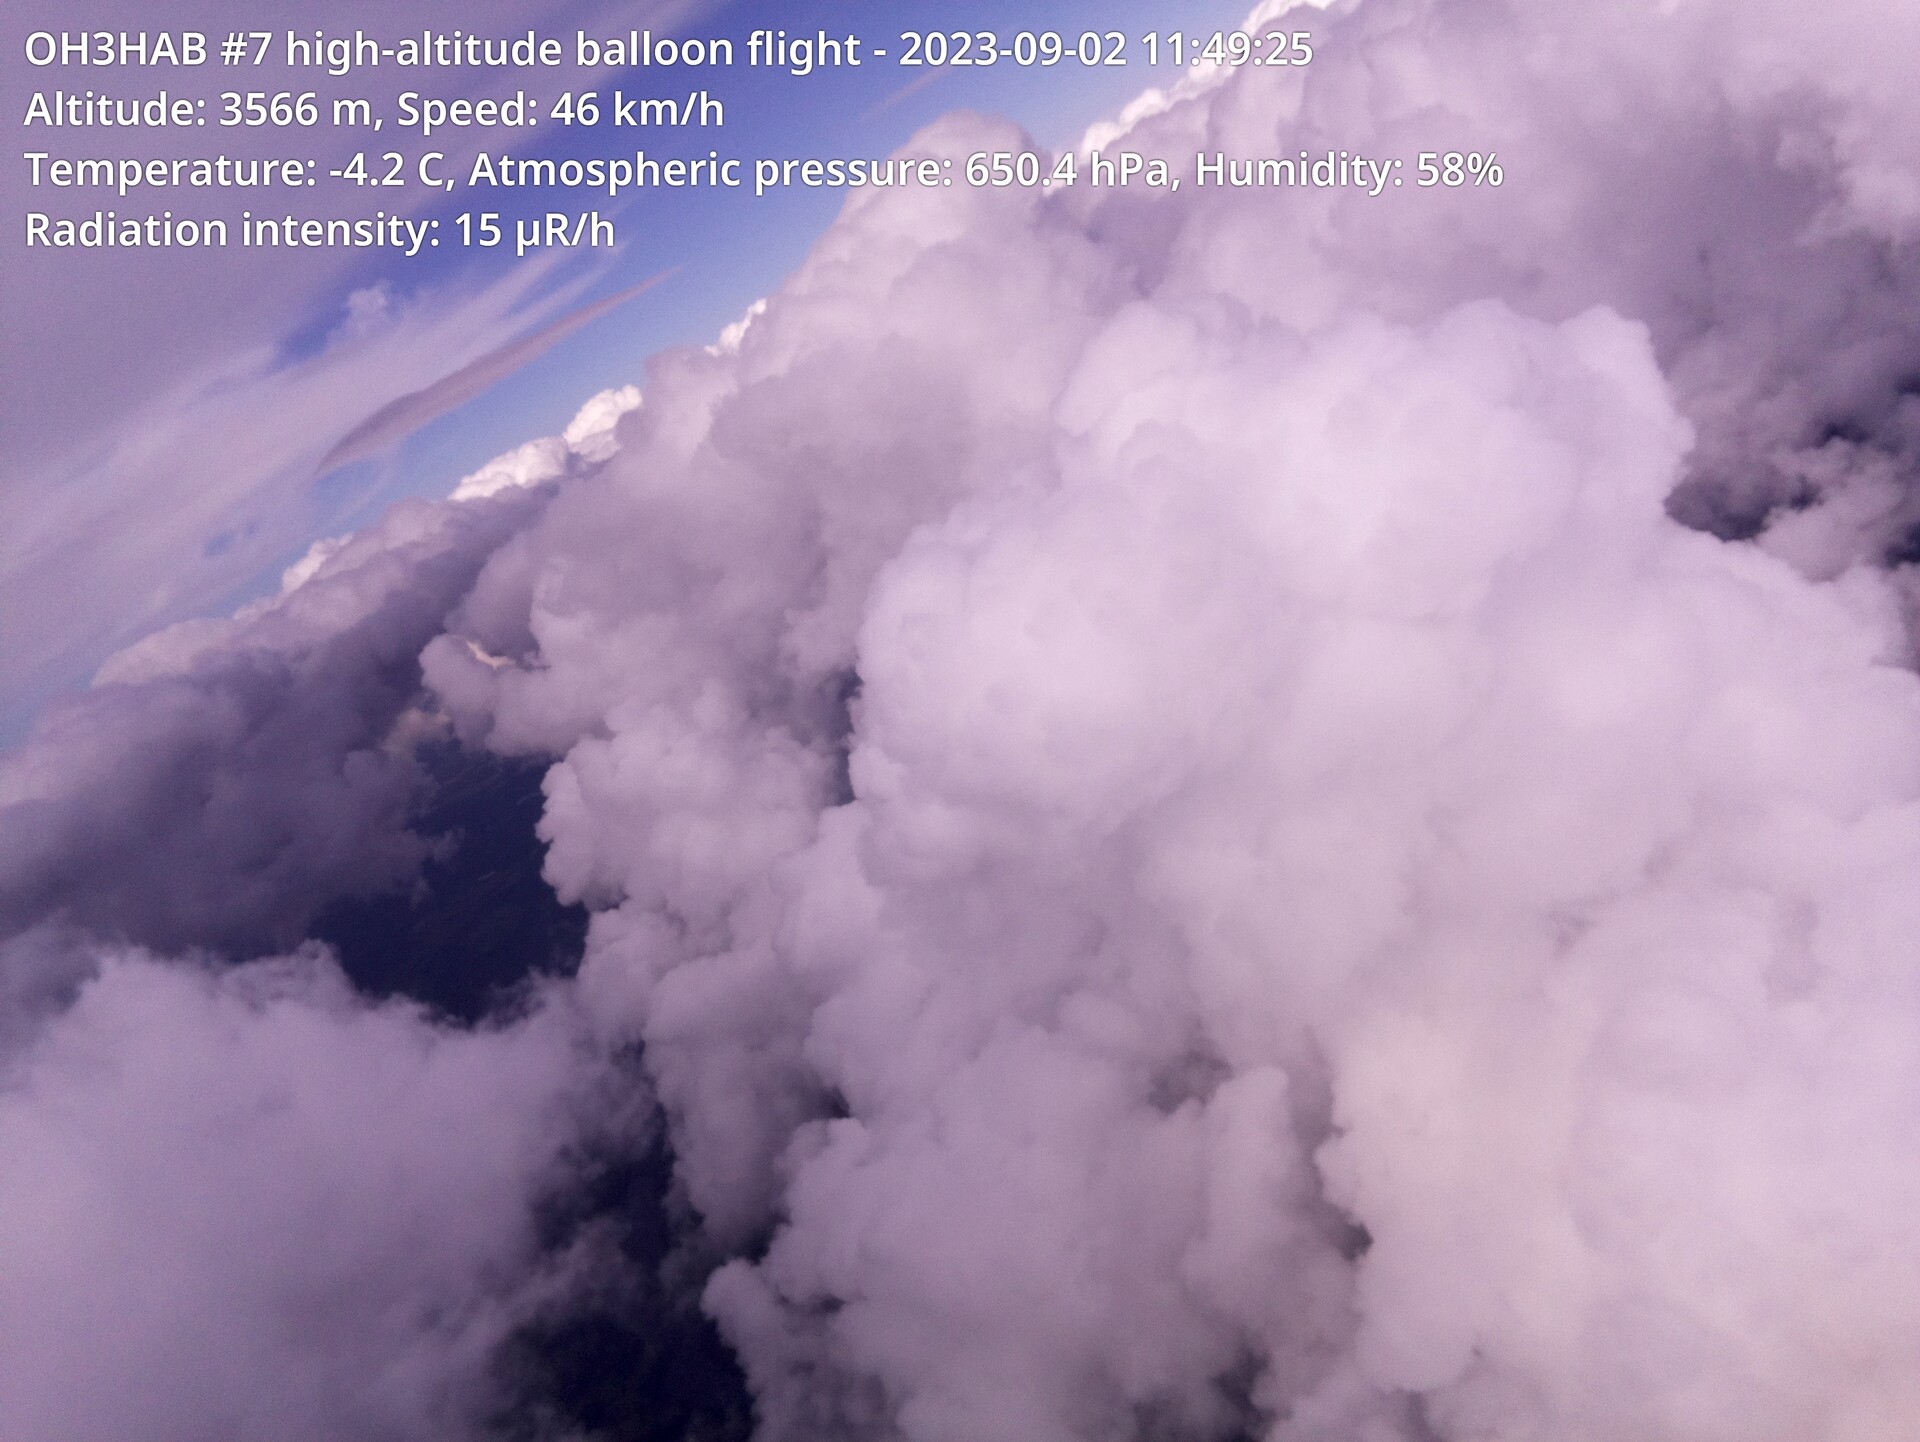
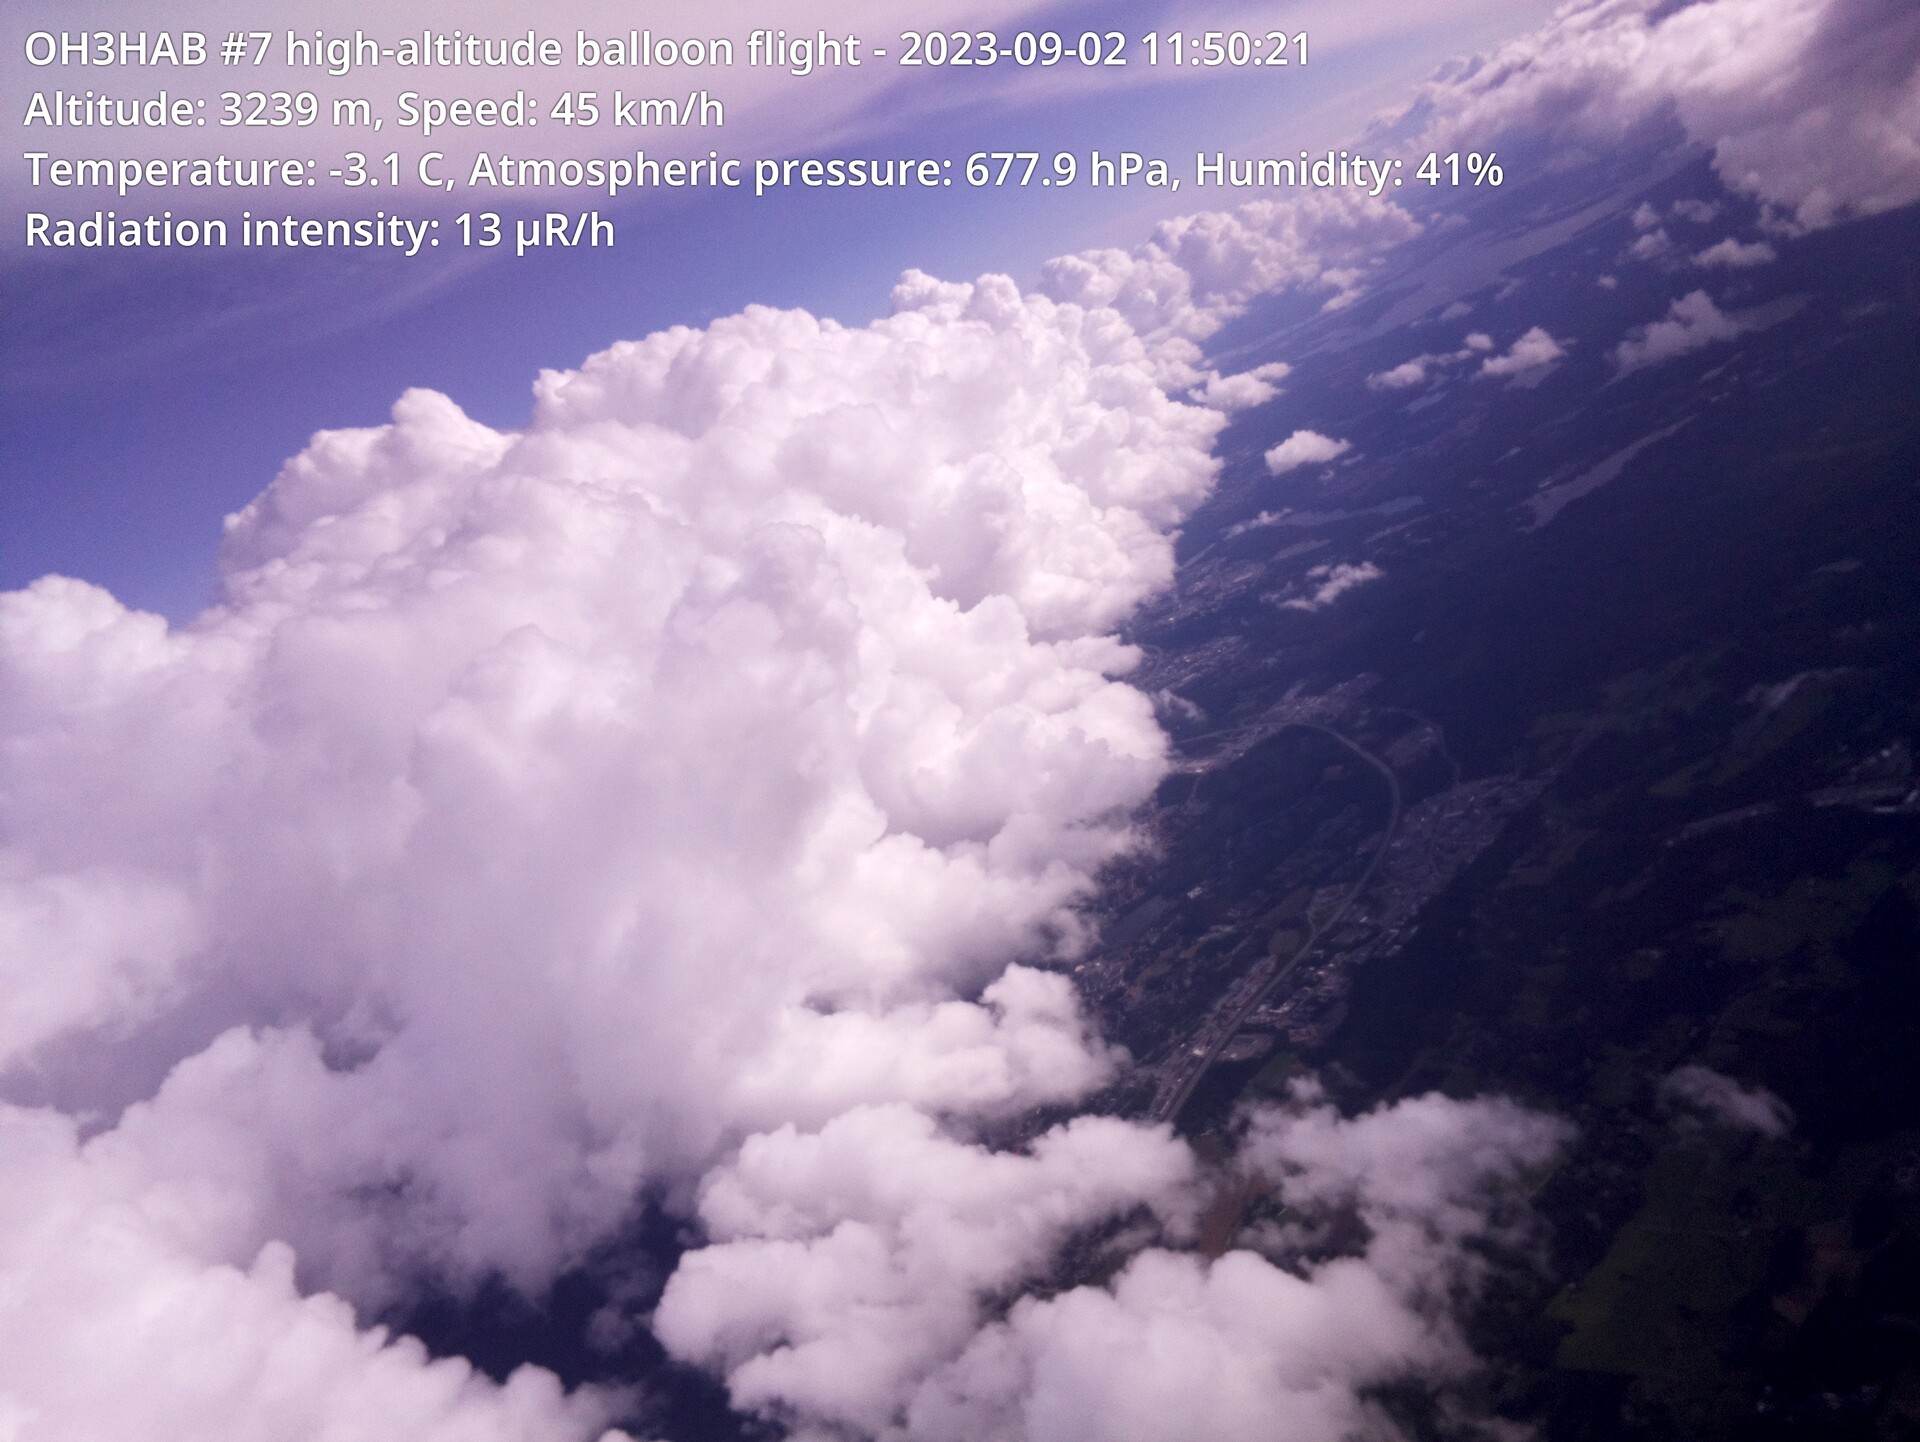
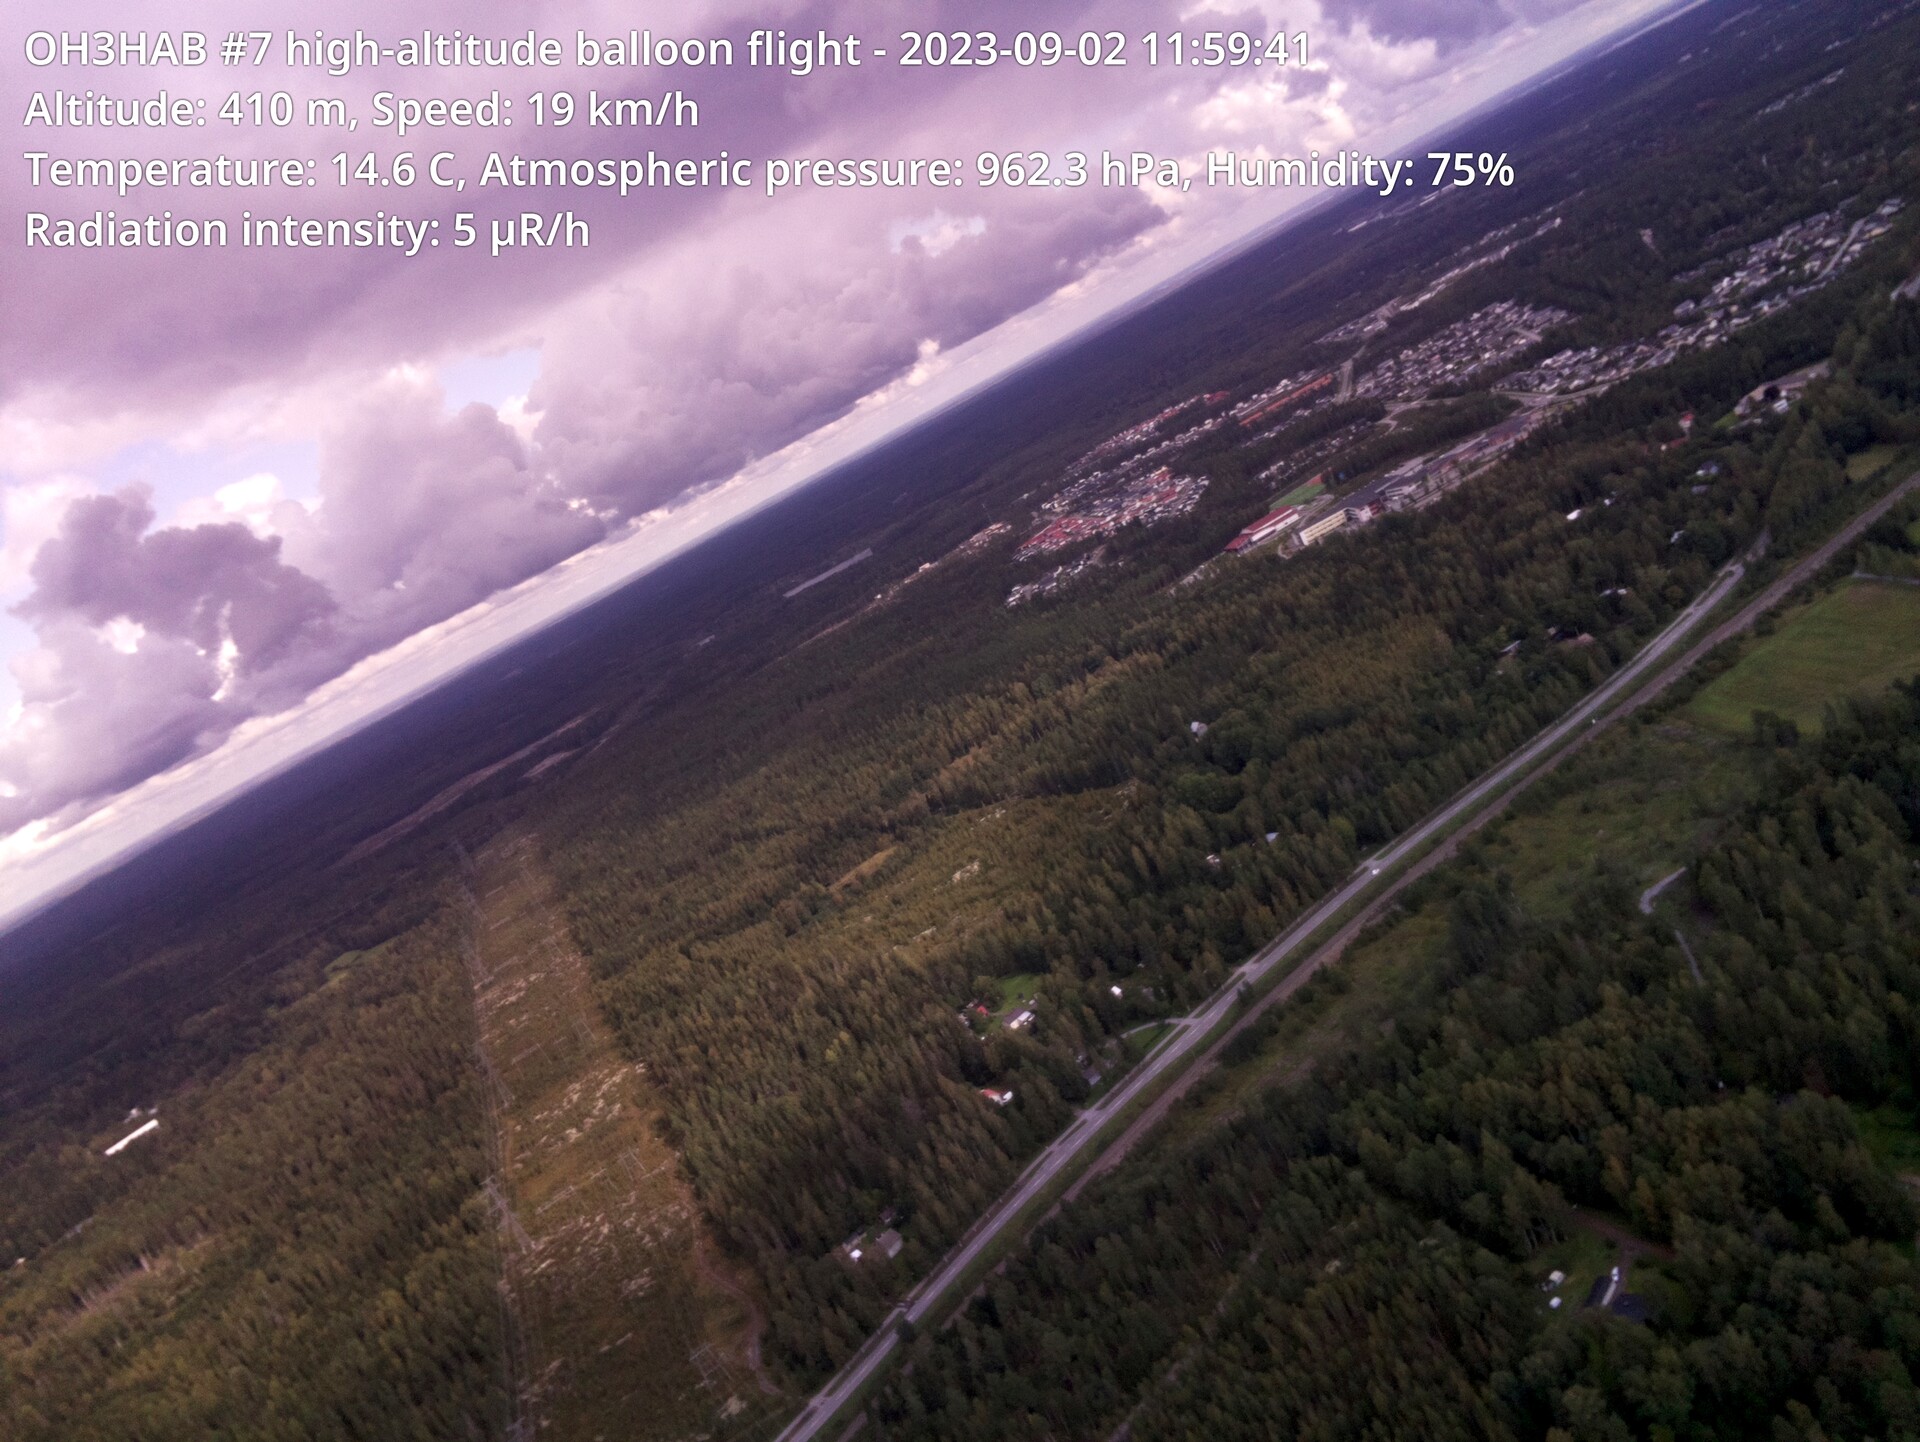
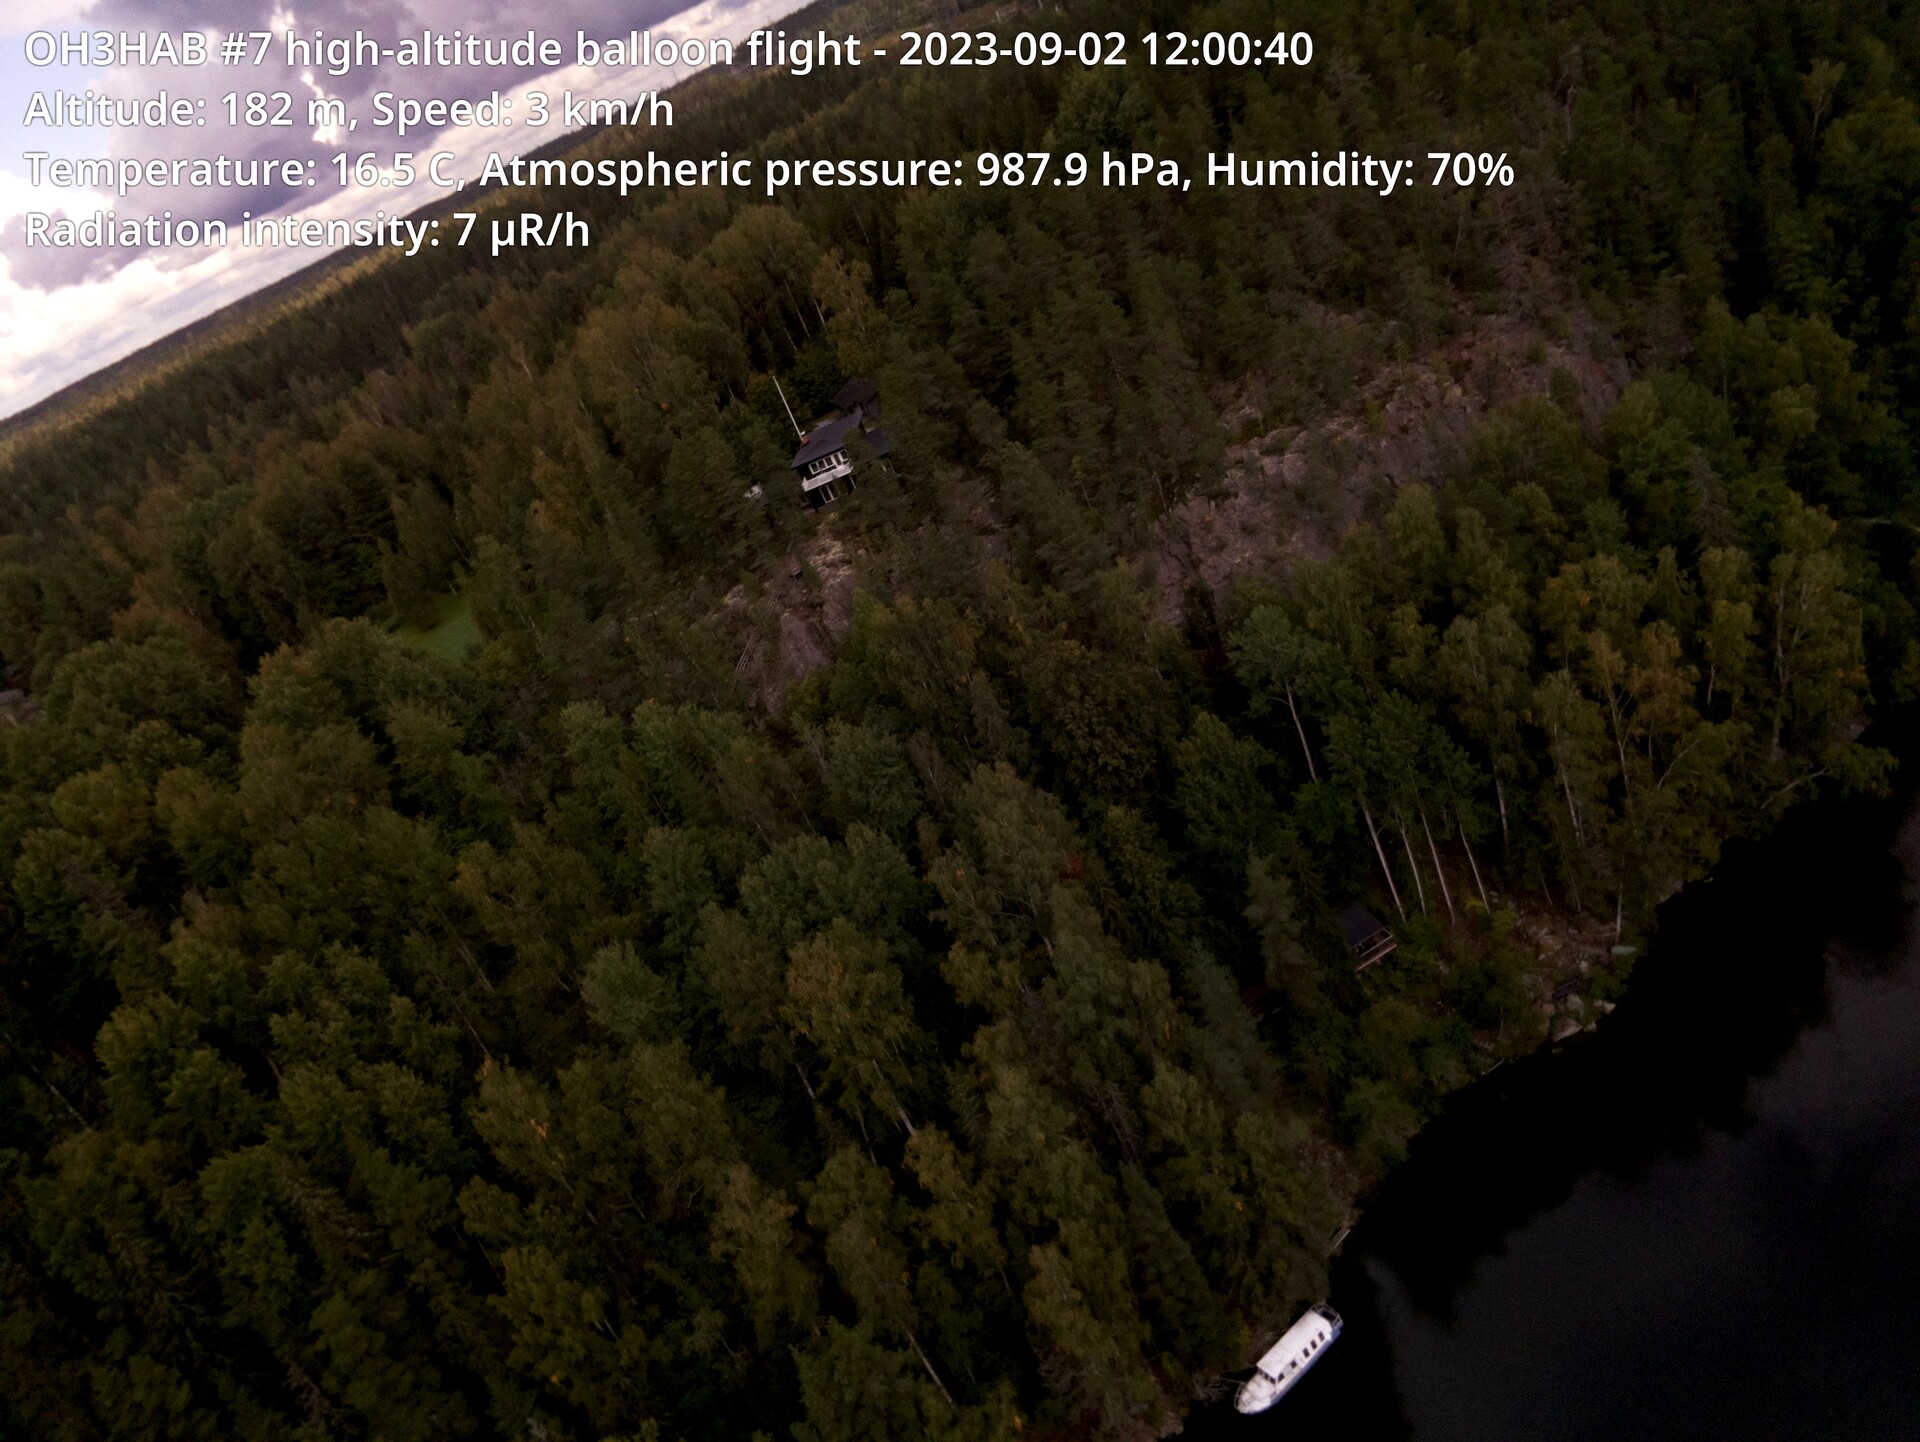
The approaching rain front produced some beautiful cloud formations. There is no accurate information about the altitude and location of the images, because the GPS receiver of the Wenet image transmitter did not work.
You can click a photo to display a larger version of it.
It is worth noting that the Raspberry Pi v2 camera does not distort the horizon much, because it is not a wide-angle camera, so the curvature of the horizon in the images is quite realistic!
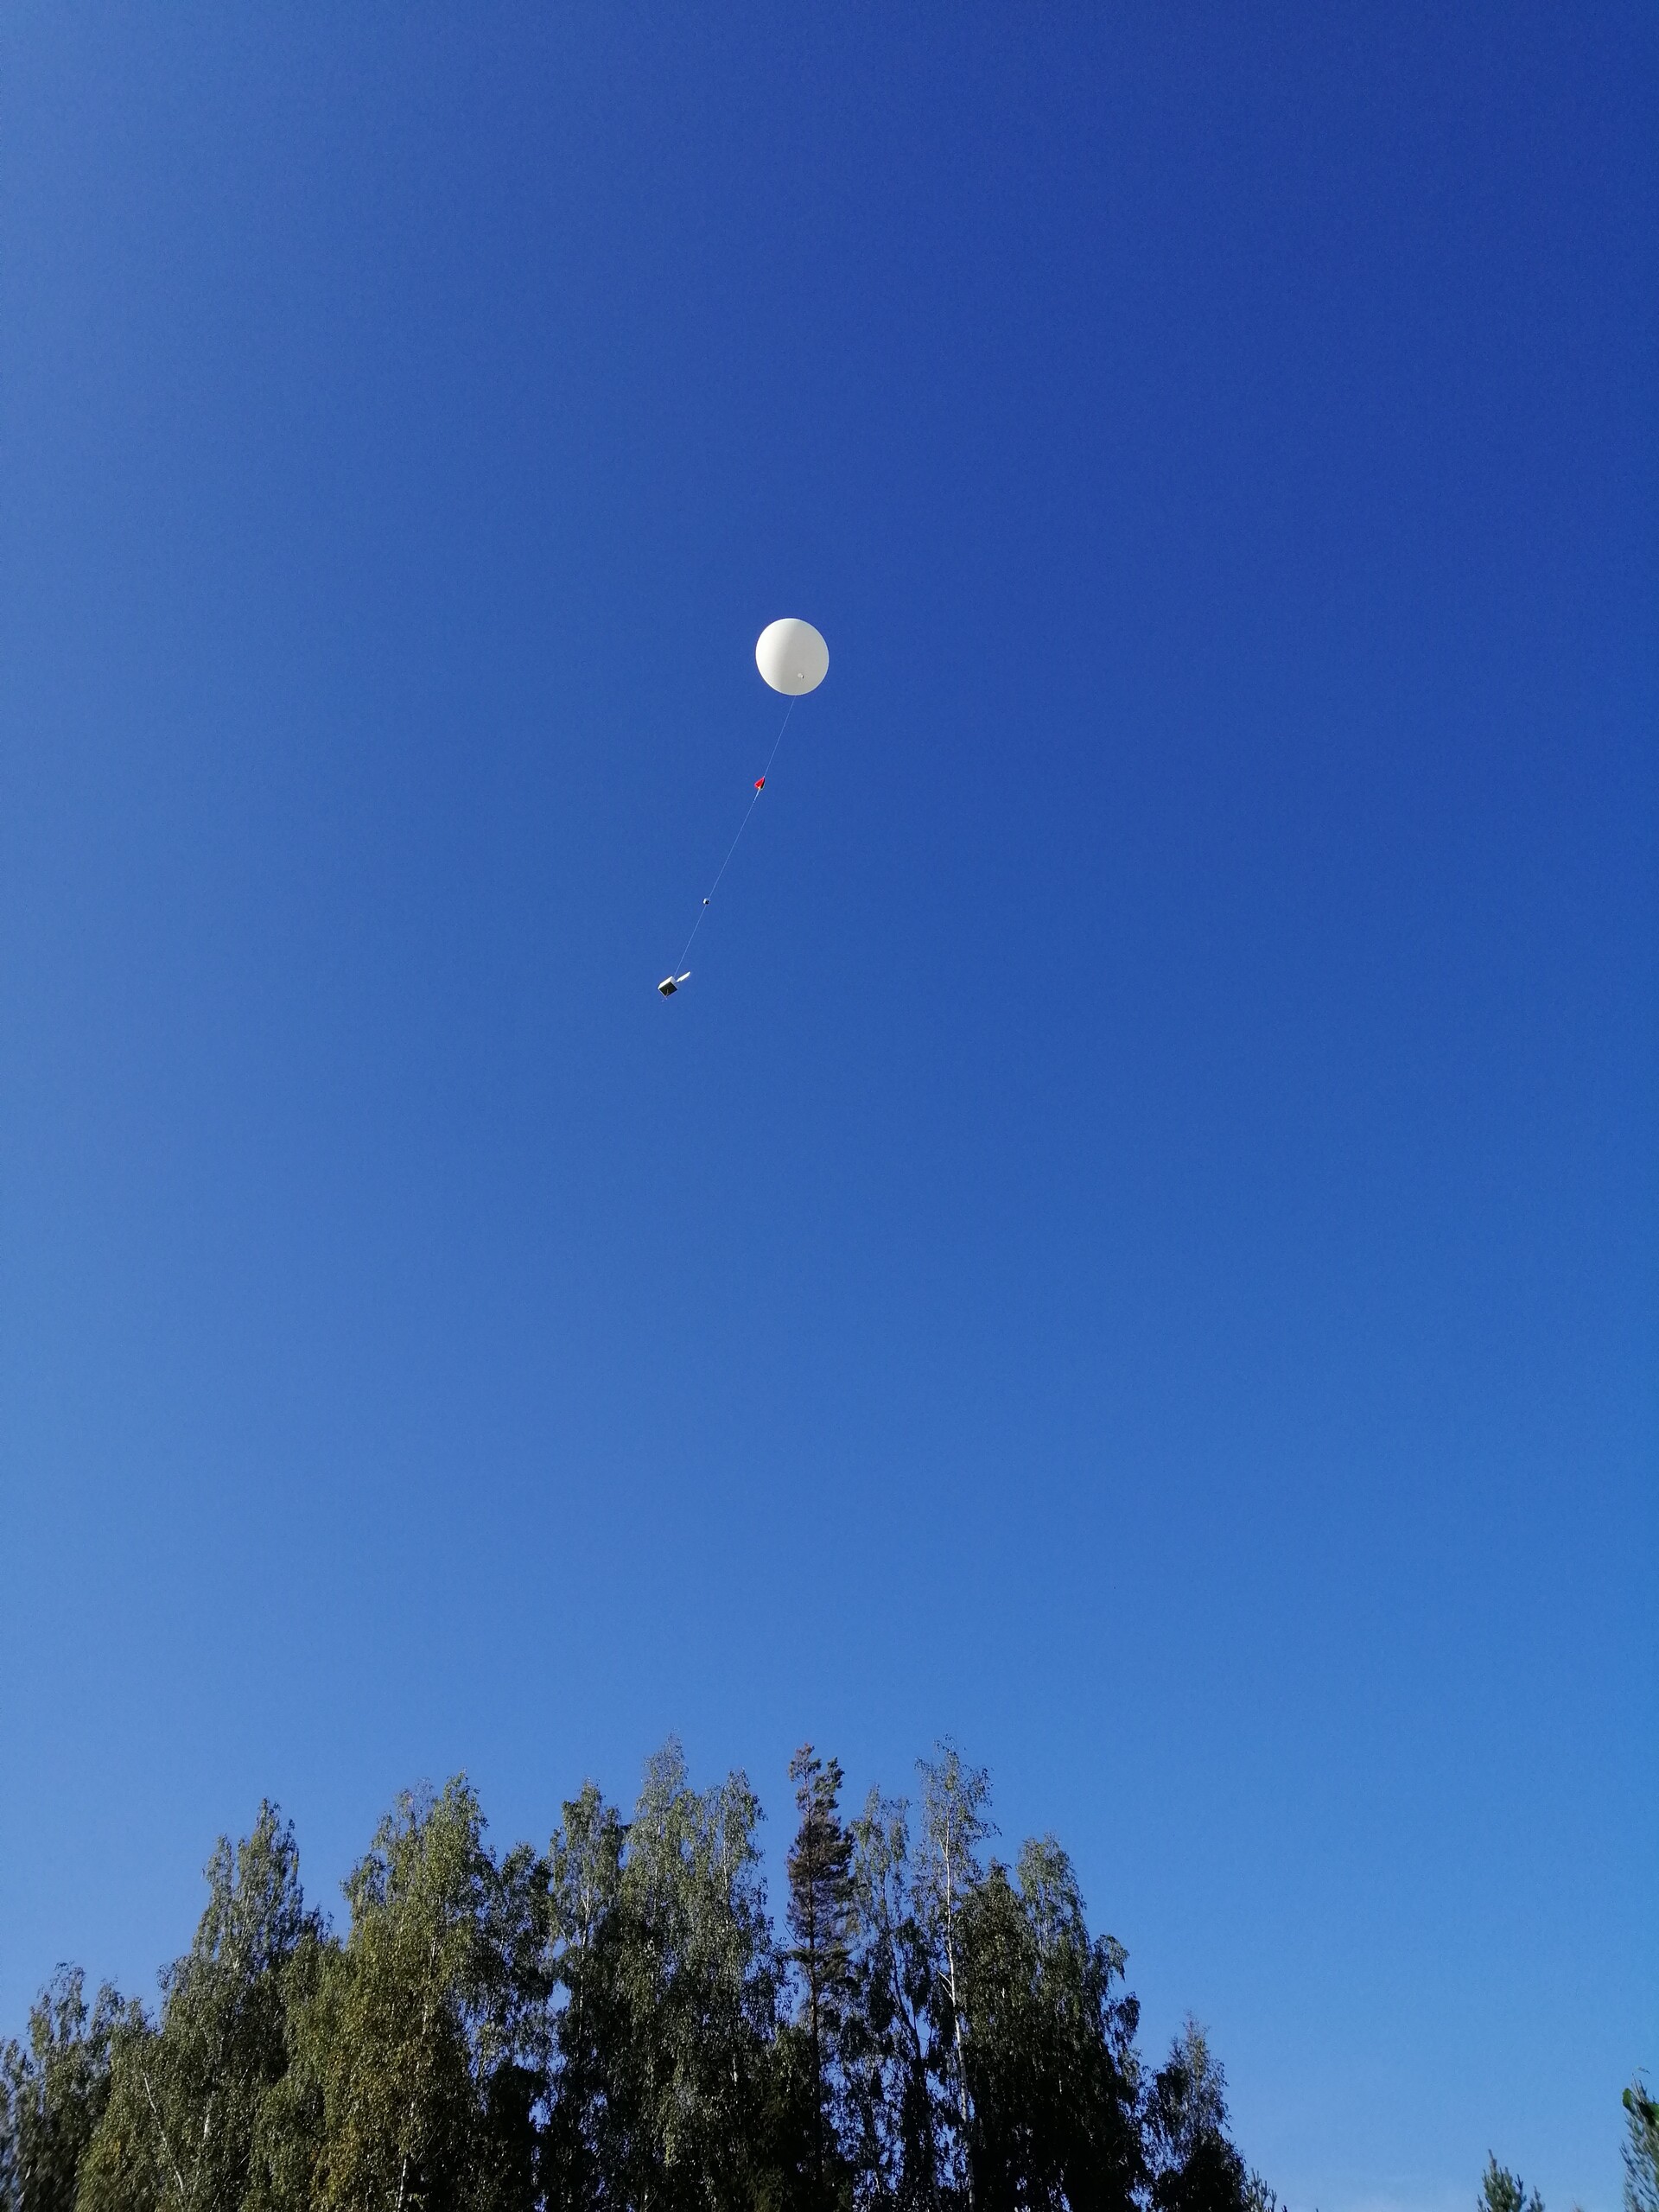
Flight path and landing
The flight path forecasts from the predict.sondehub.org flight prediction service were again quite reliable. The prediction indicated that the maximum altitude for a 600g latex balloon and a payload of about 600g with an ascent rate of 5 m/s would be just over 30 kilometers. The upper atmosphere winds on the morning of the launch day would take the balloon to the northwest direction, towards the city of Tampere. The final forecast on Saturday morning showed the northwest part of the city of Nokia as the landing site, while earlier in the week the forecasts predicted the Kulju area as the landing site. The challenge in landing in the Nokia area is the large number of water bodies, which would make it more likely for the balloon payloads to fall into the water.
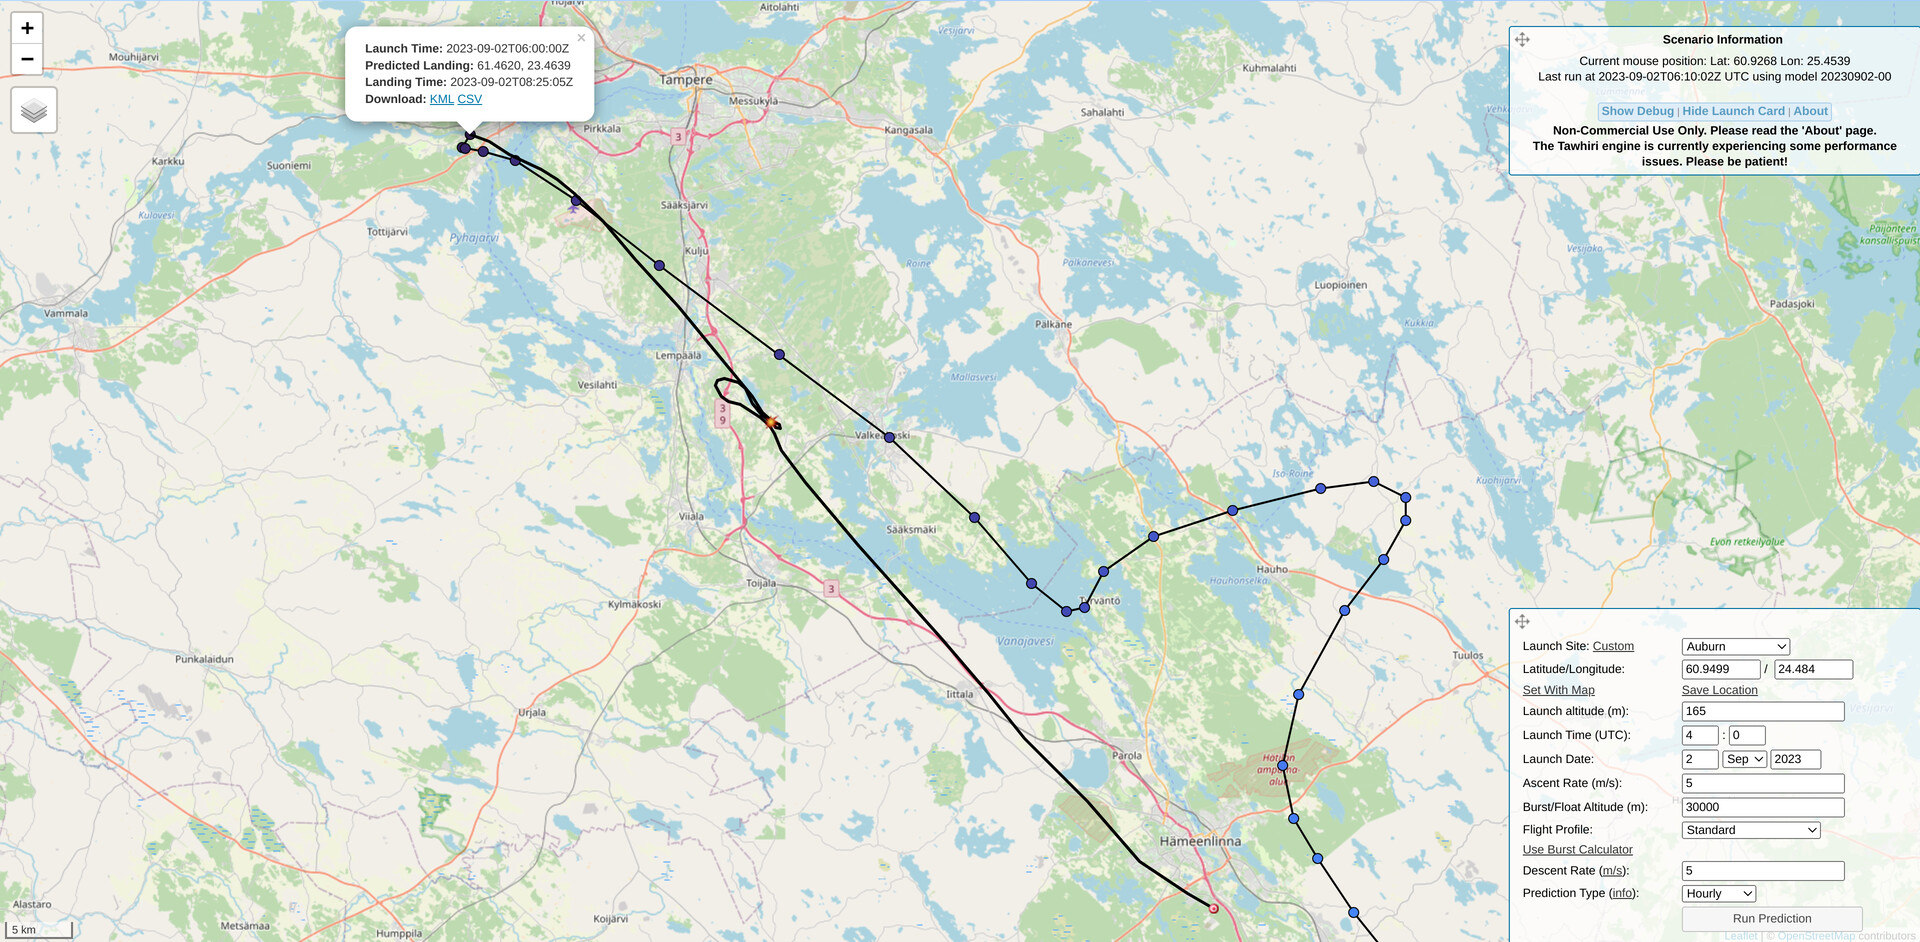
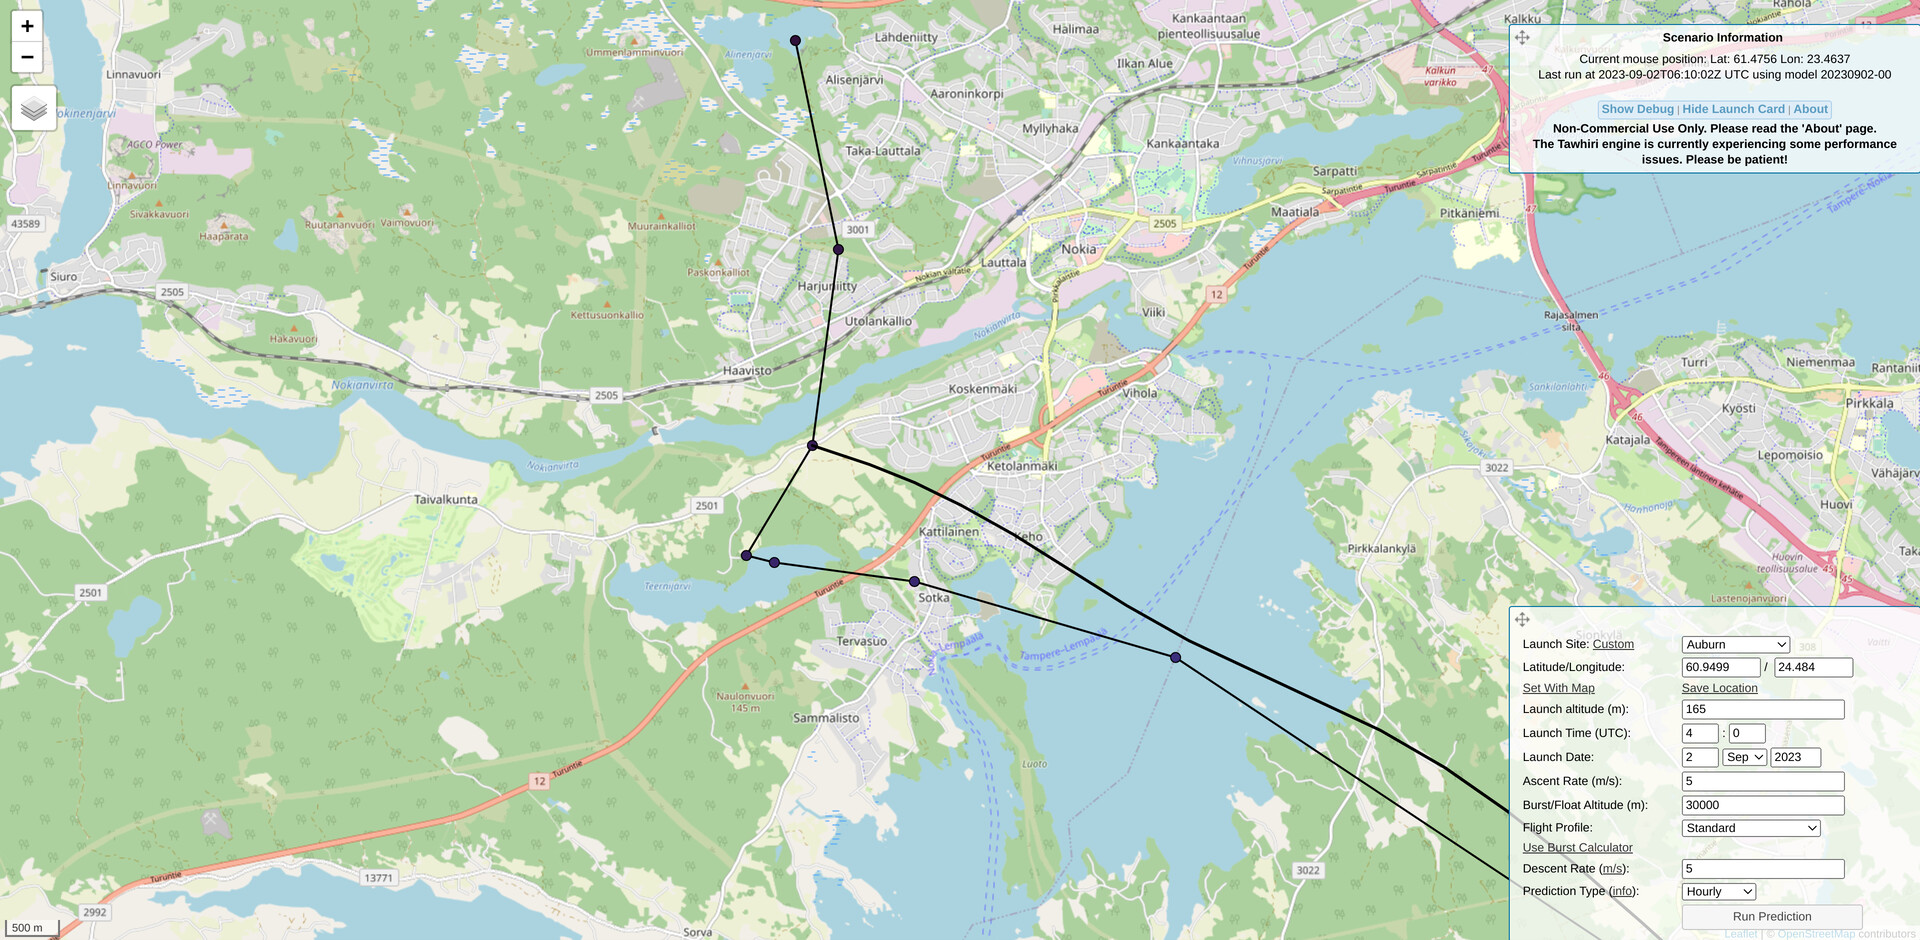
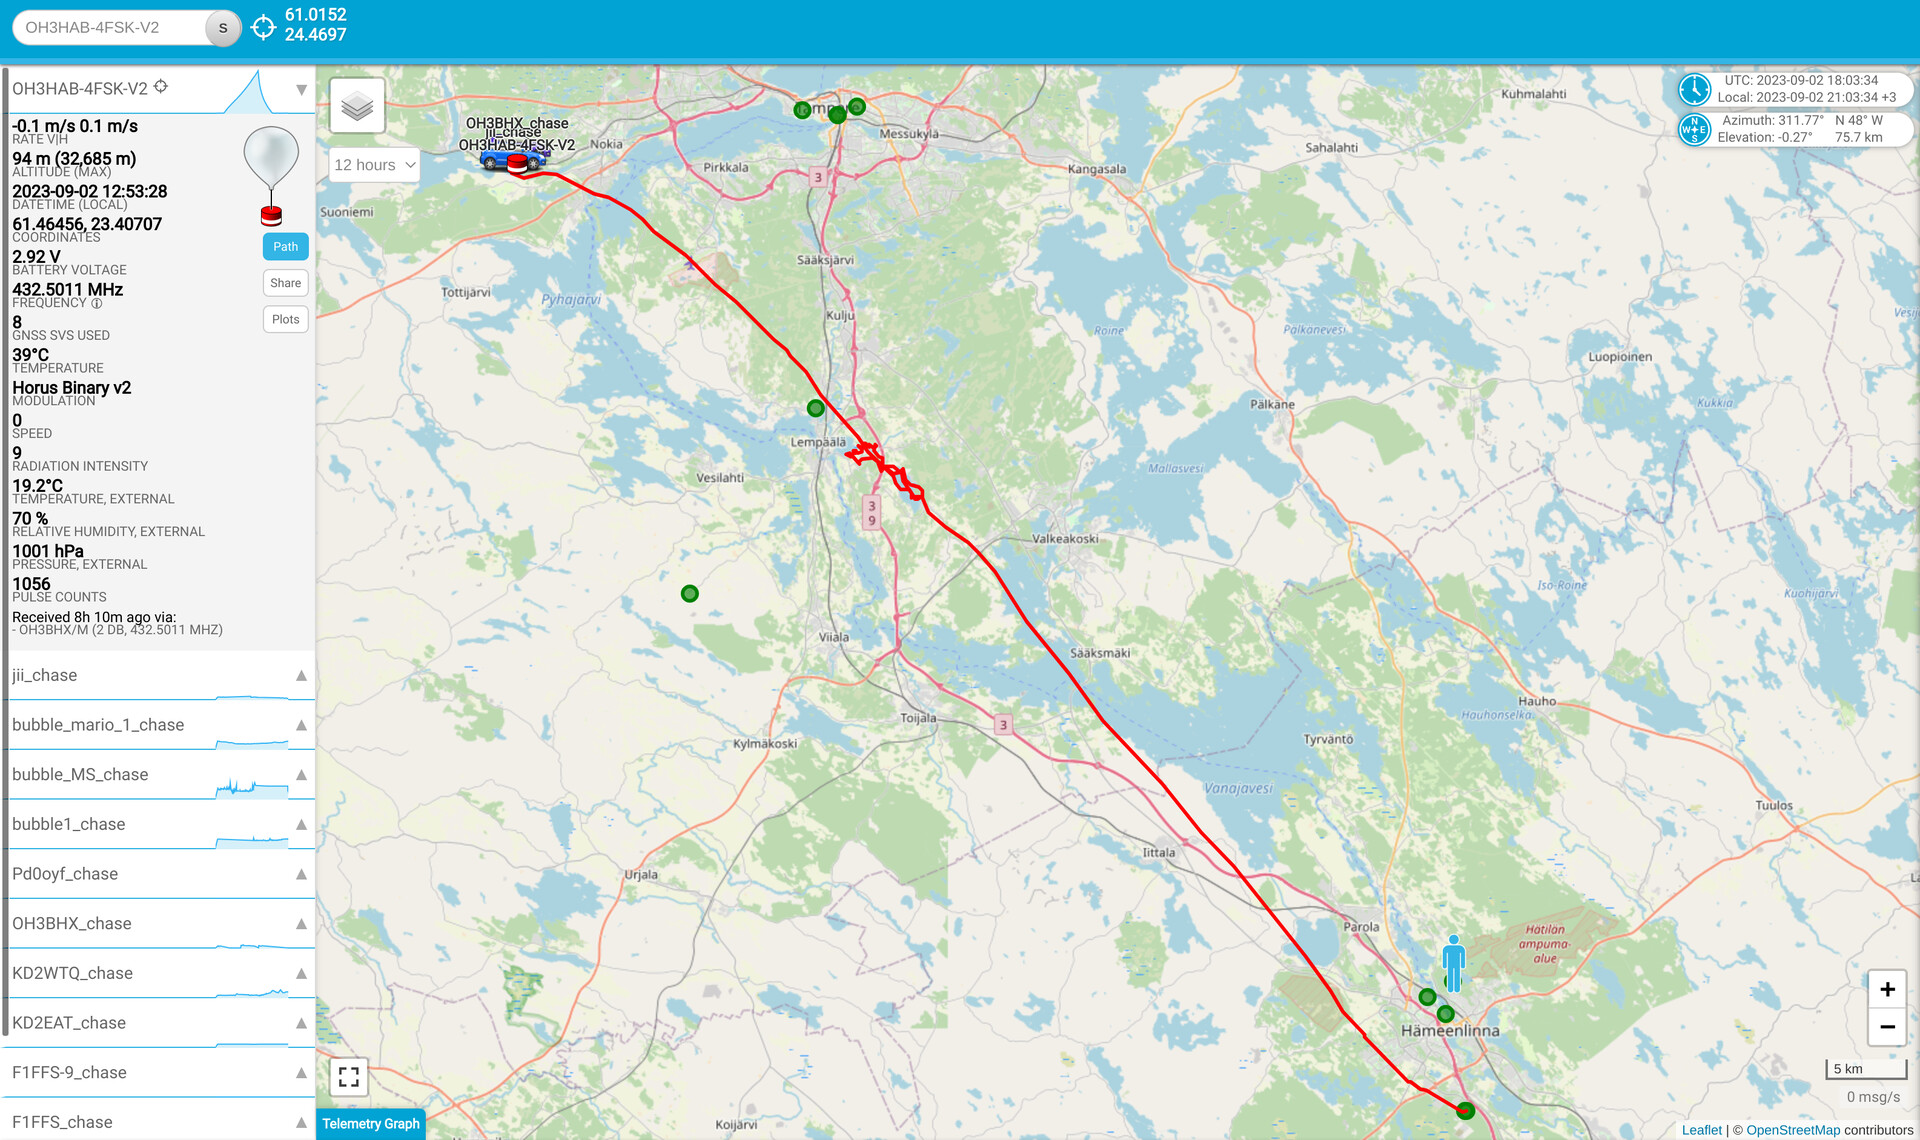
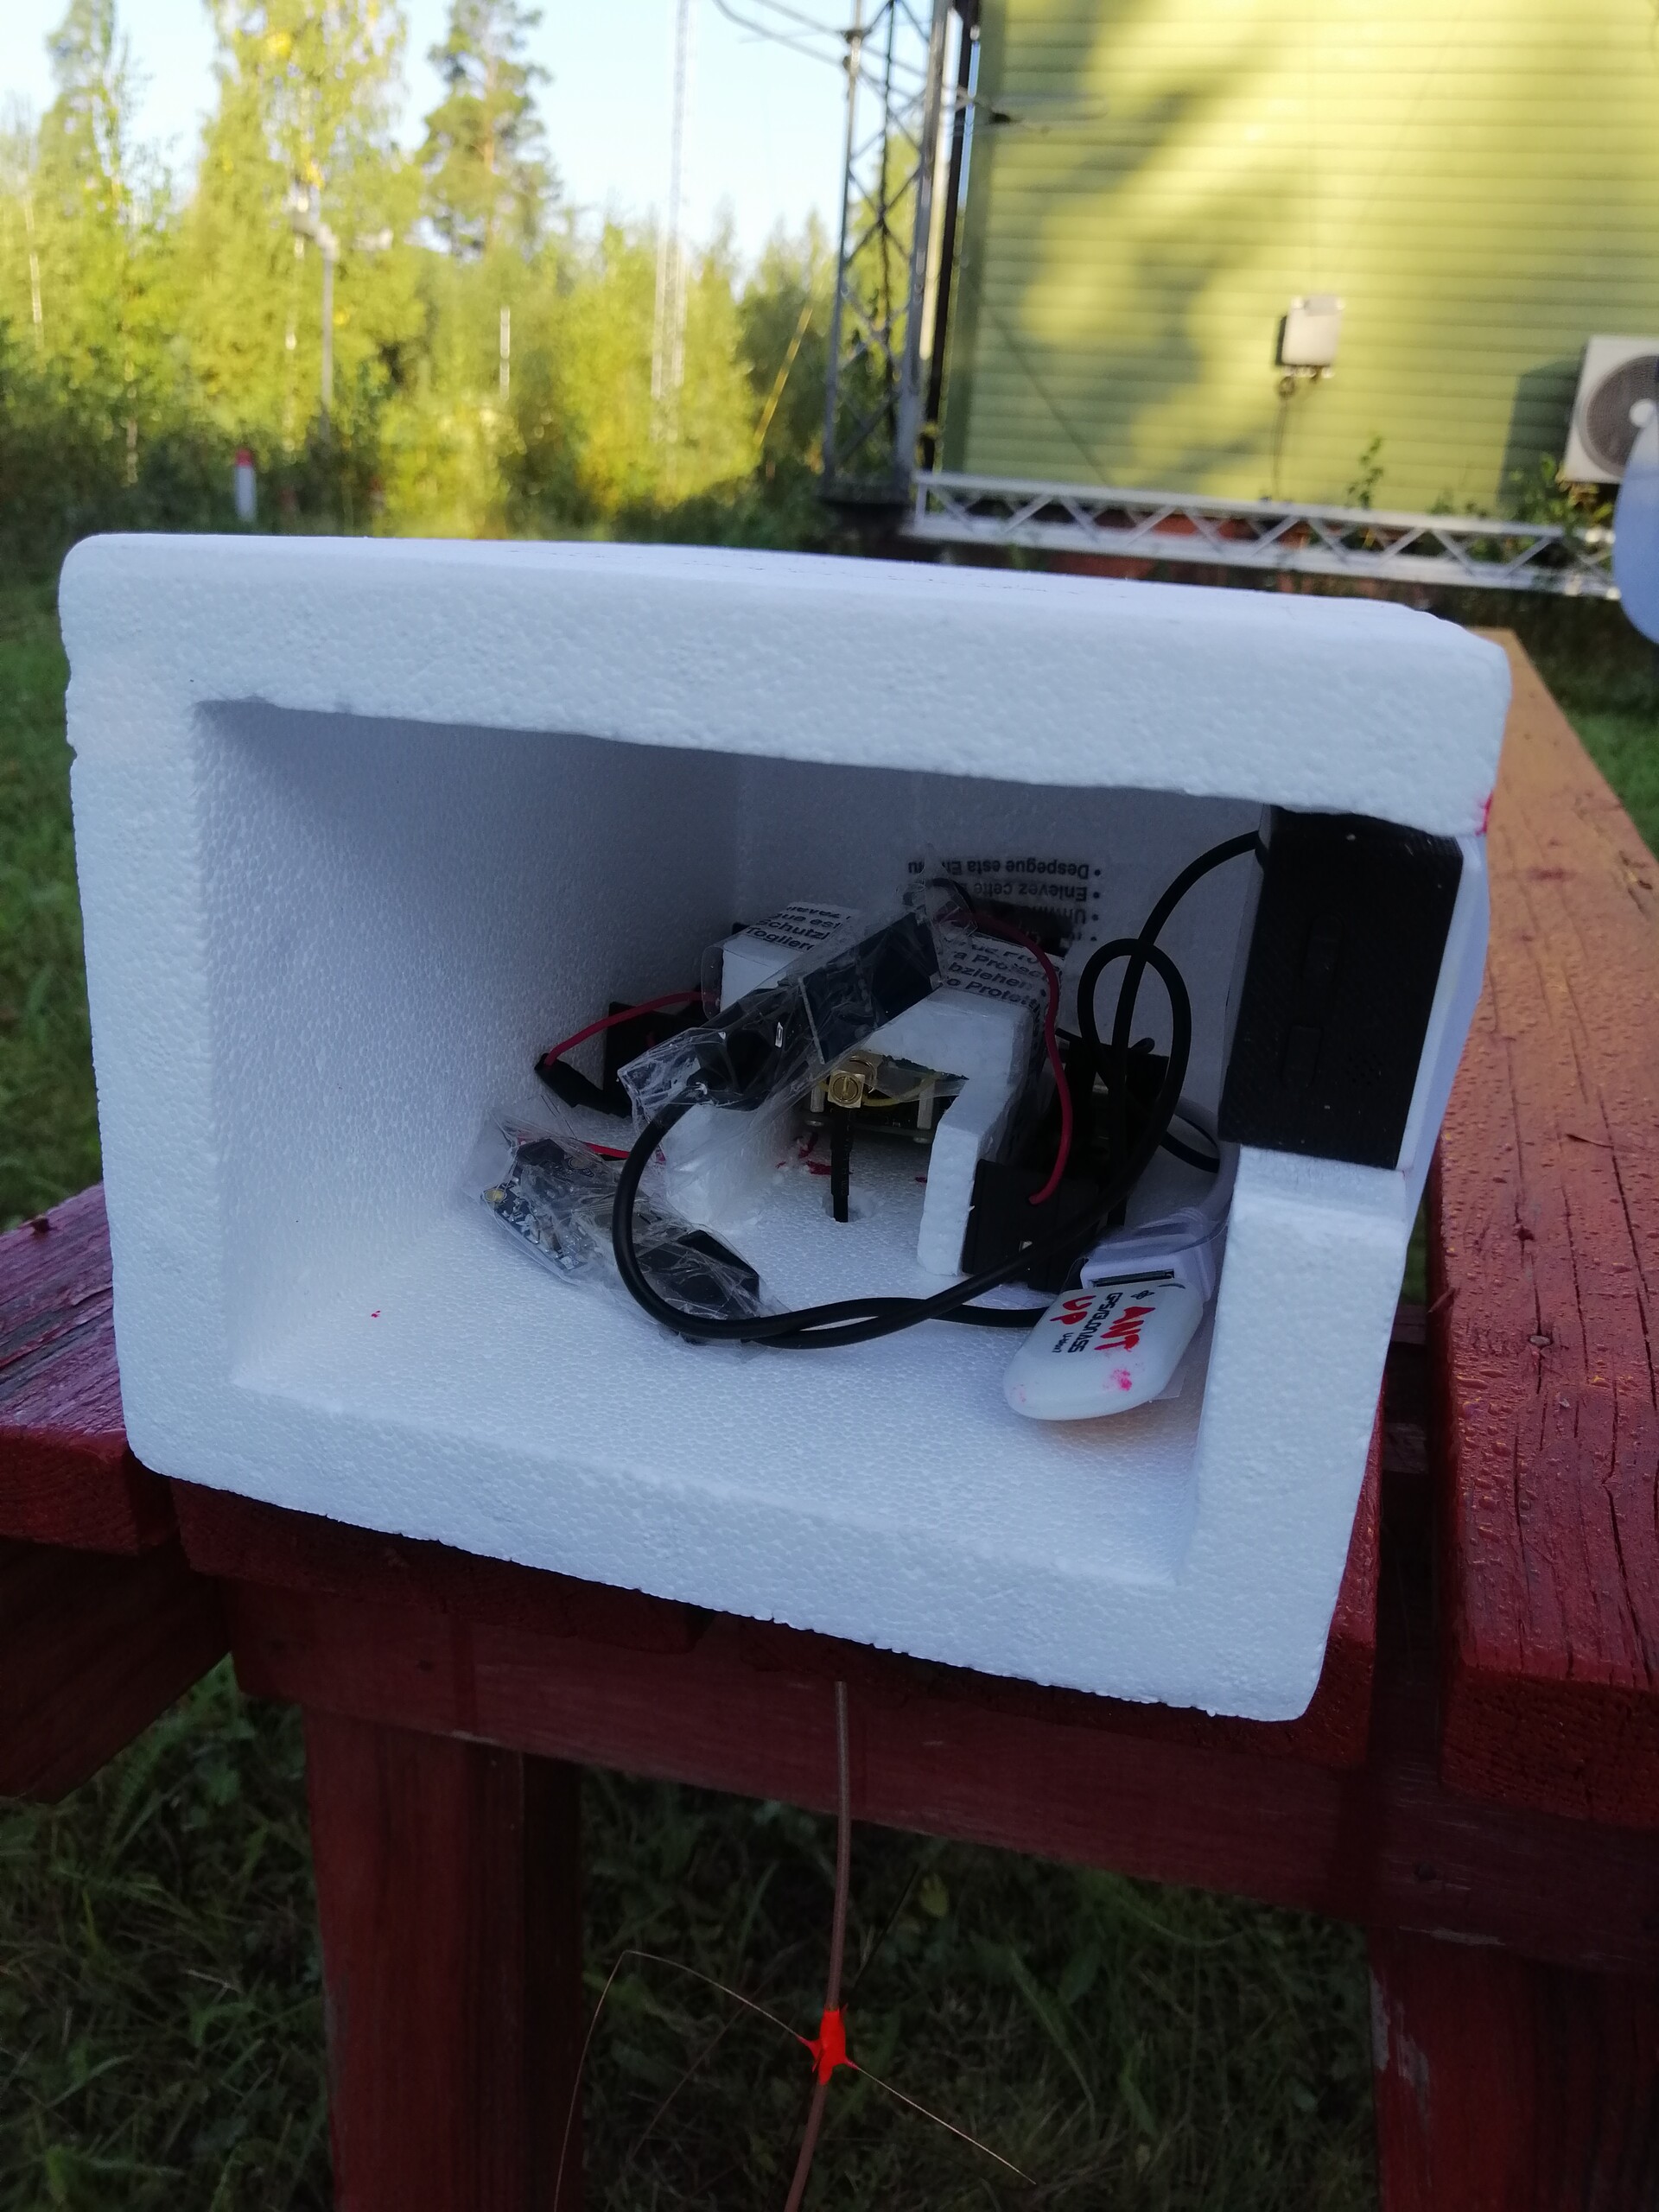
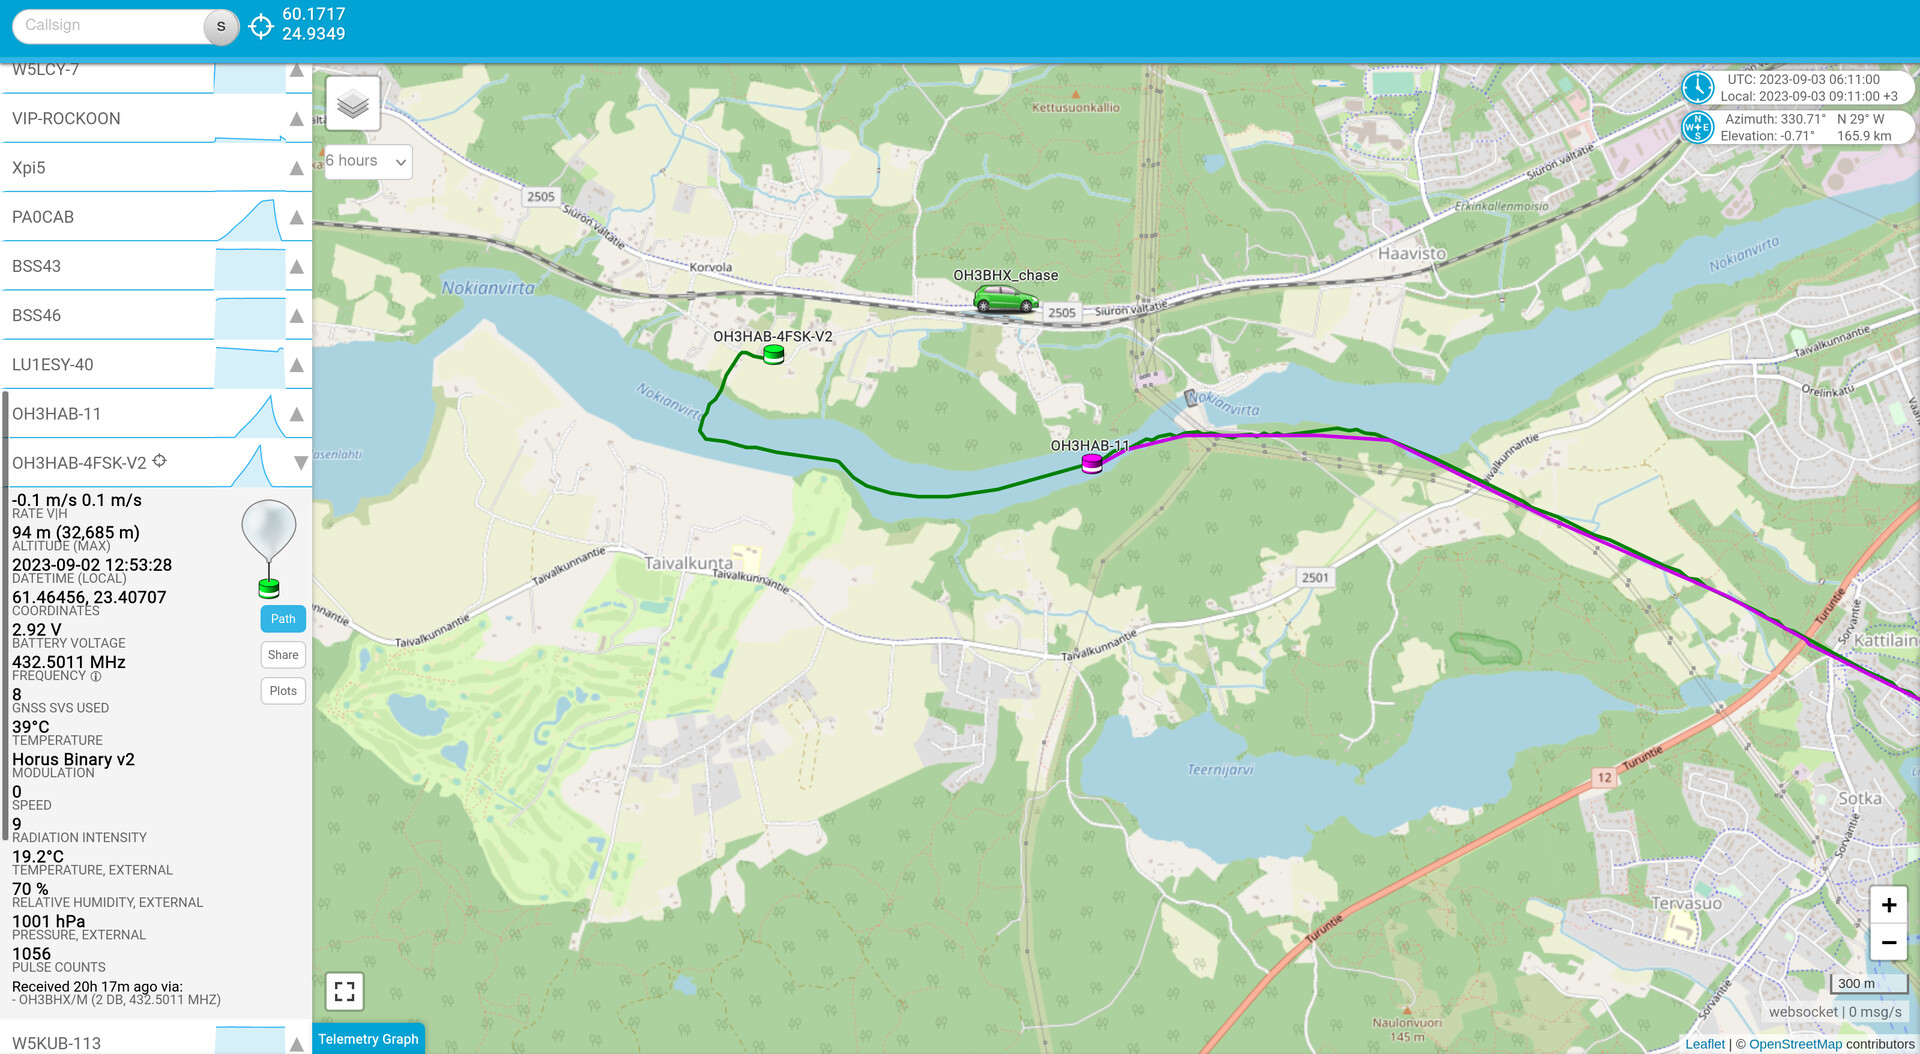
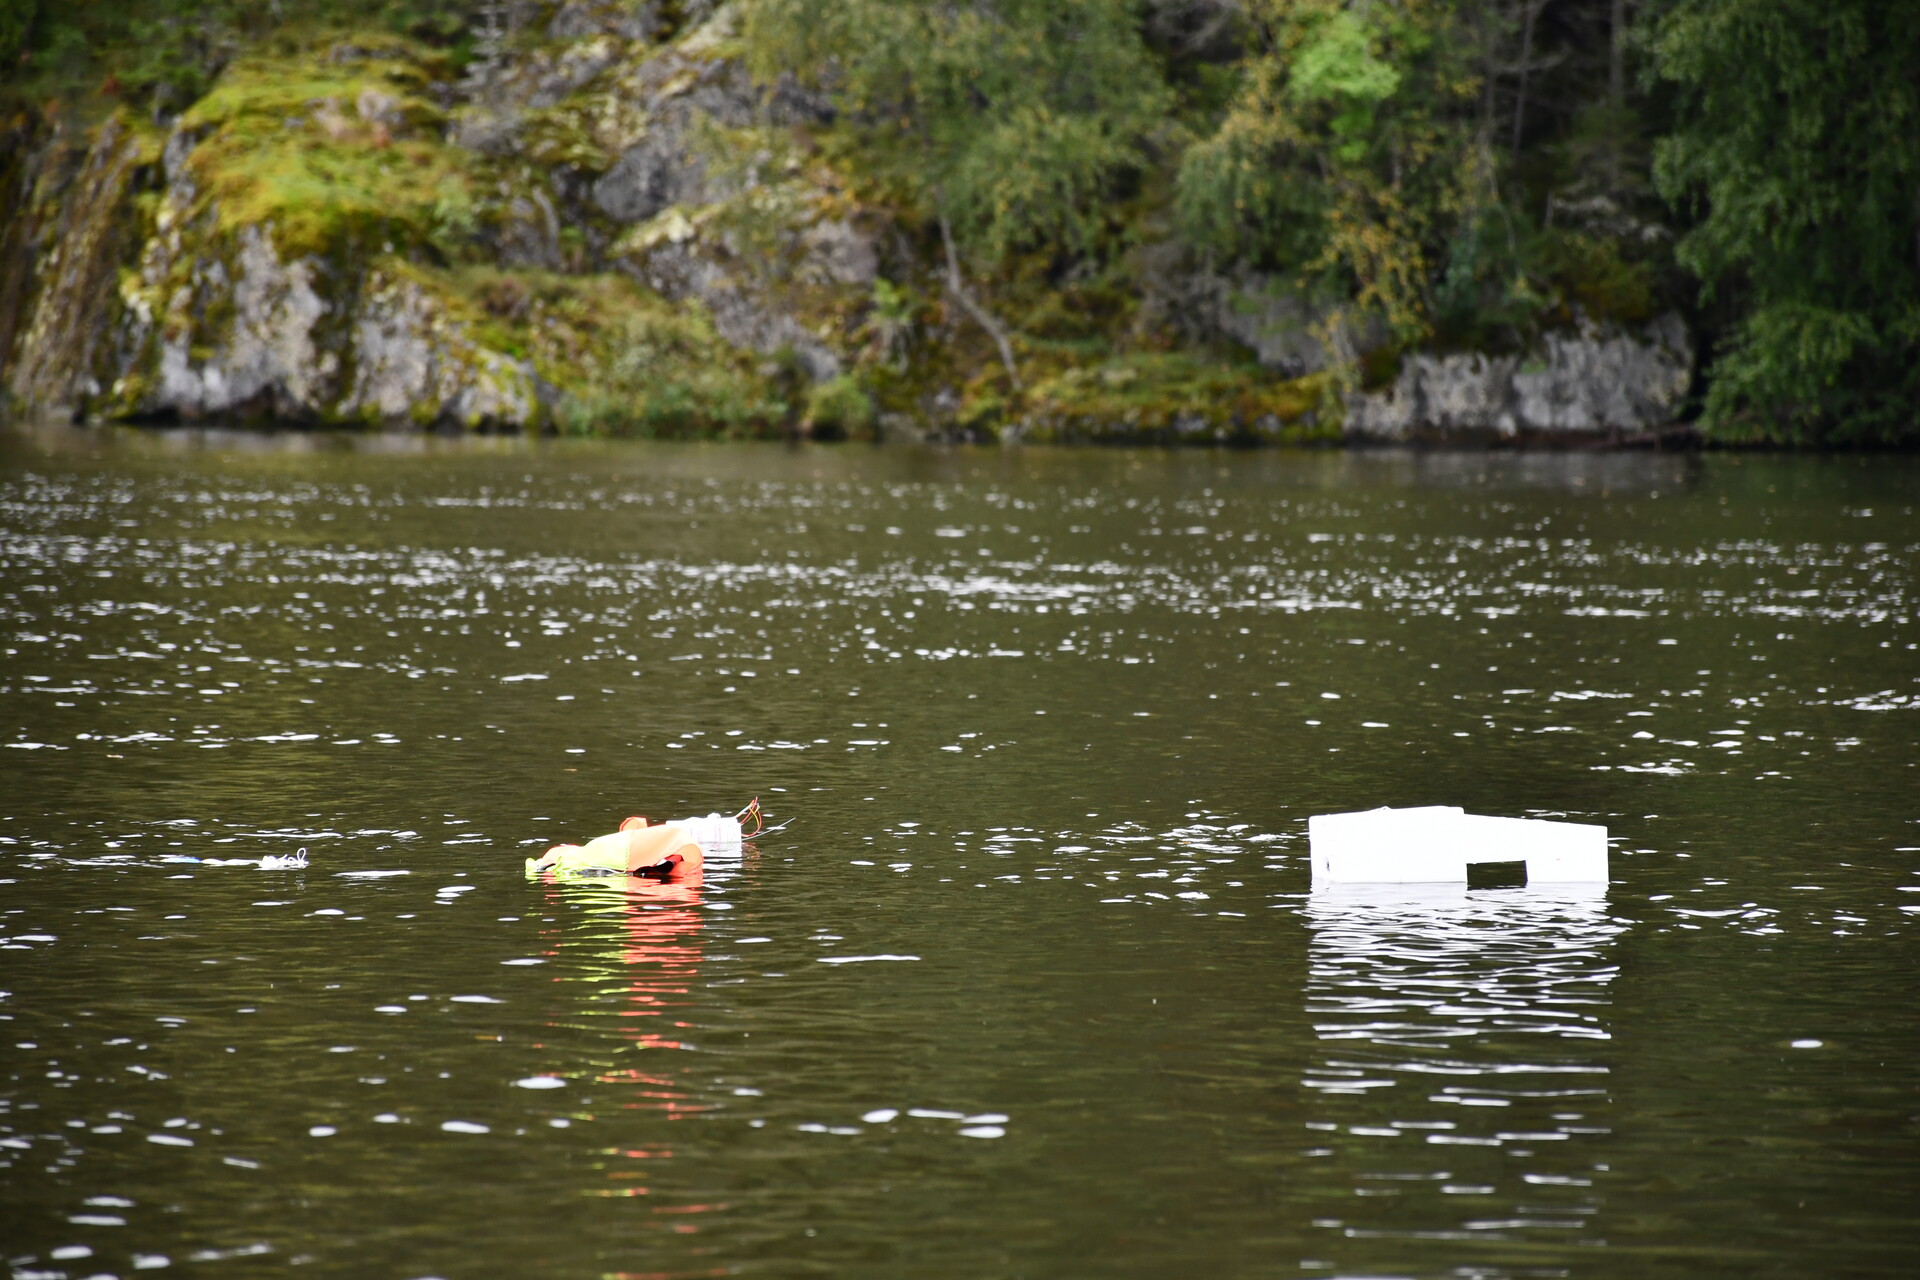
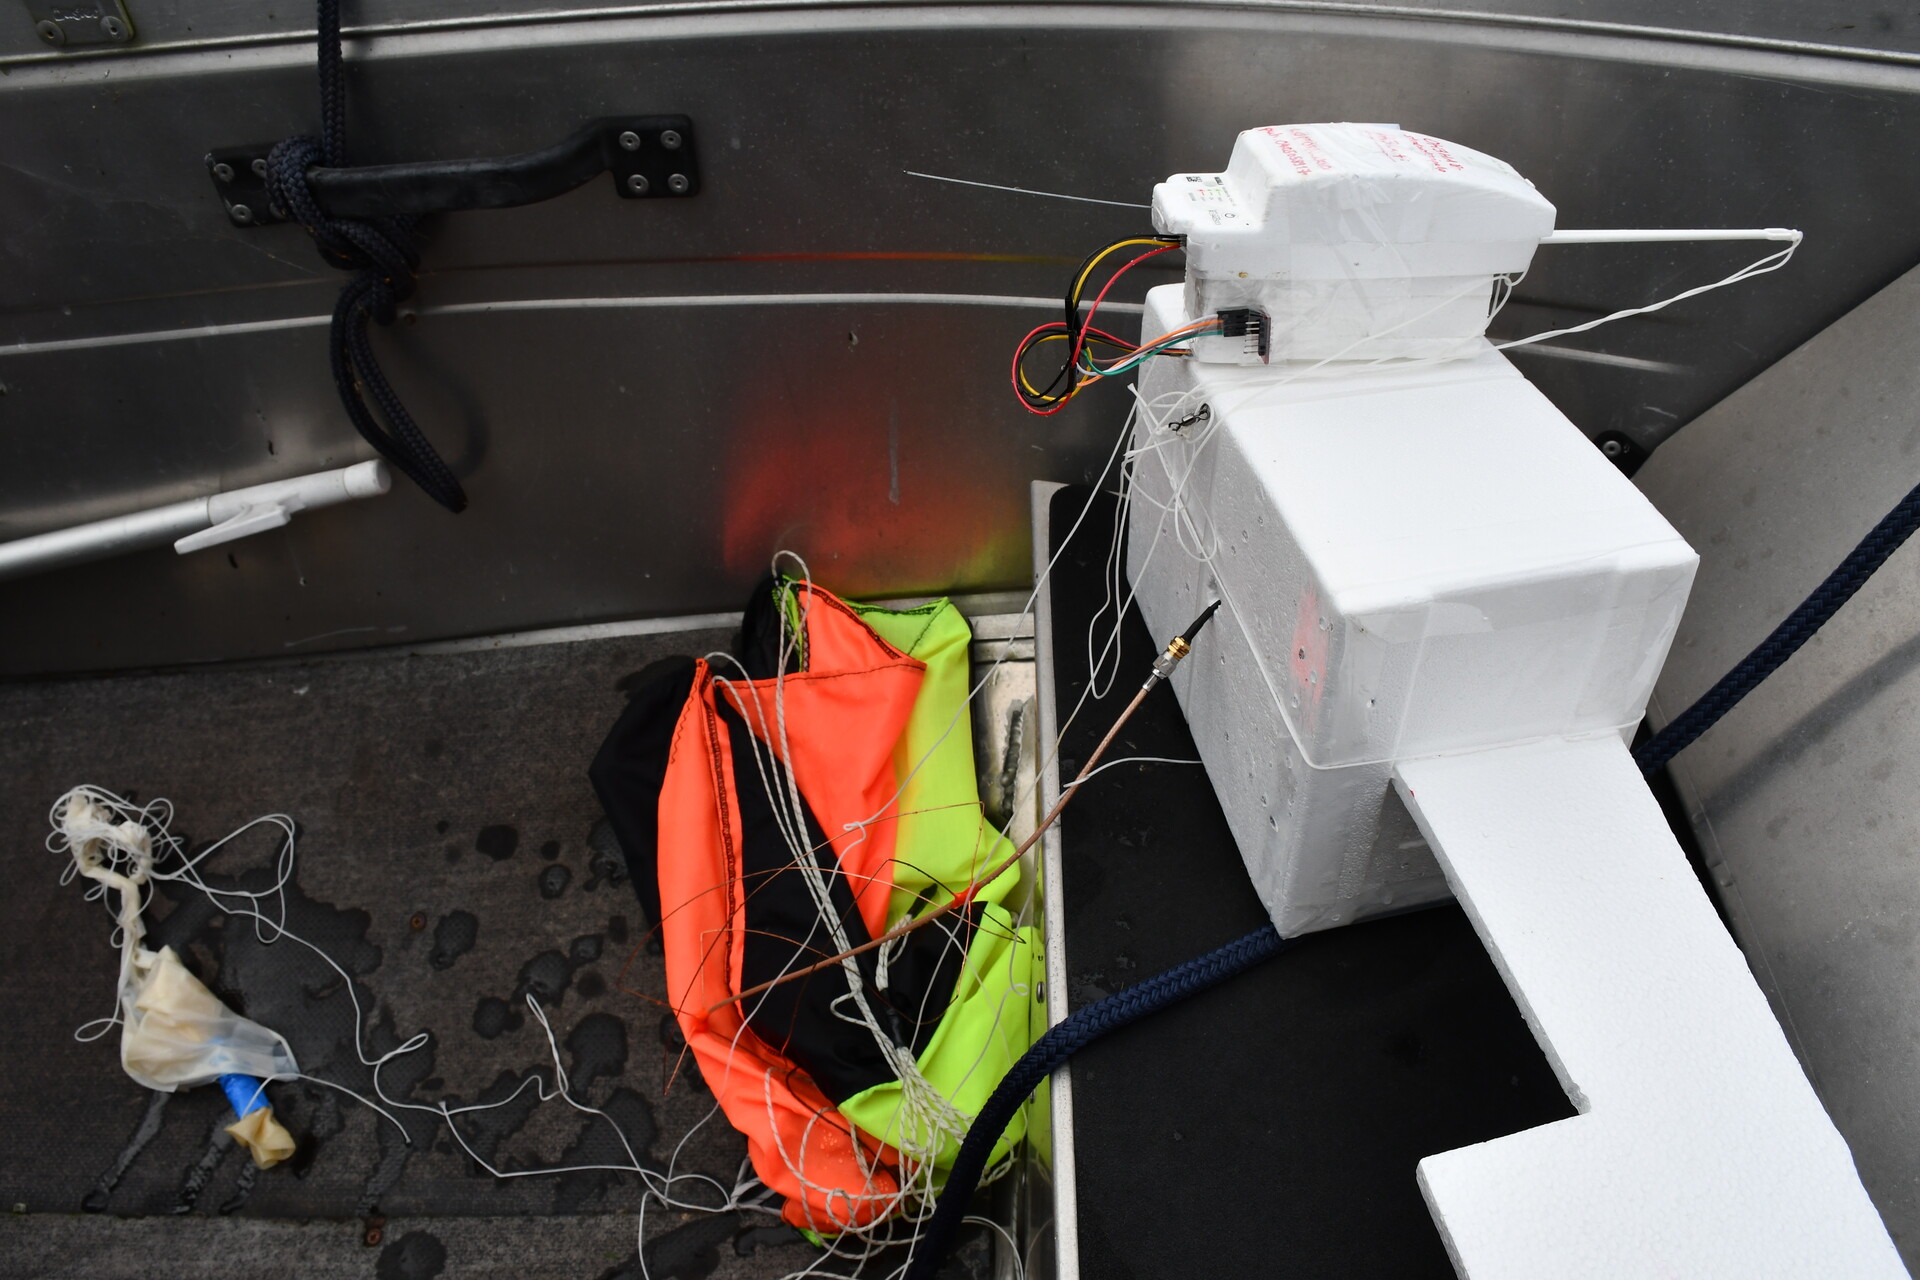
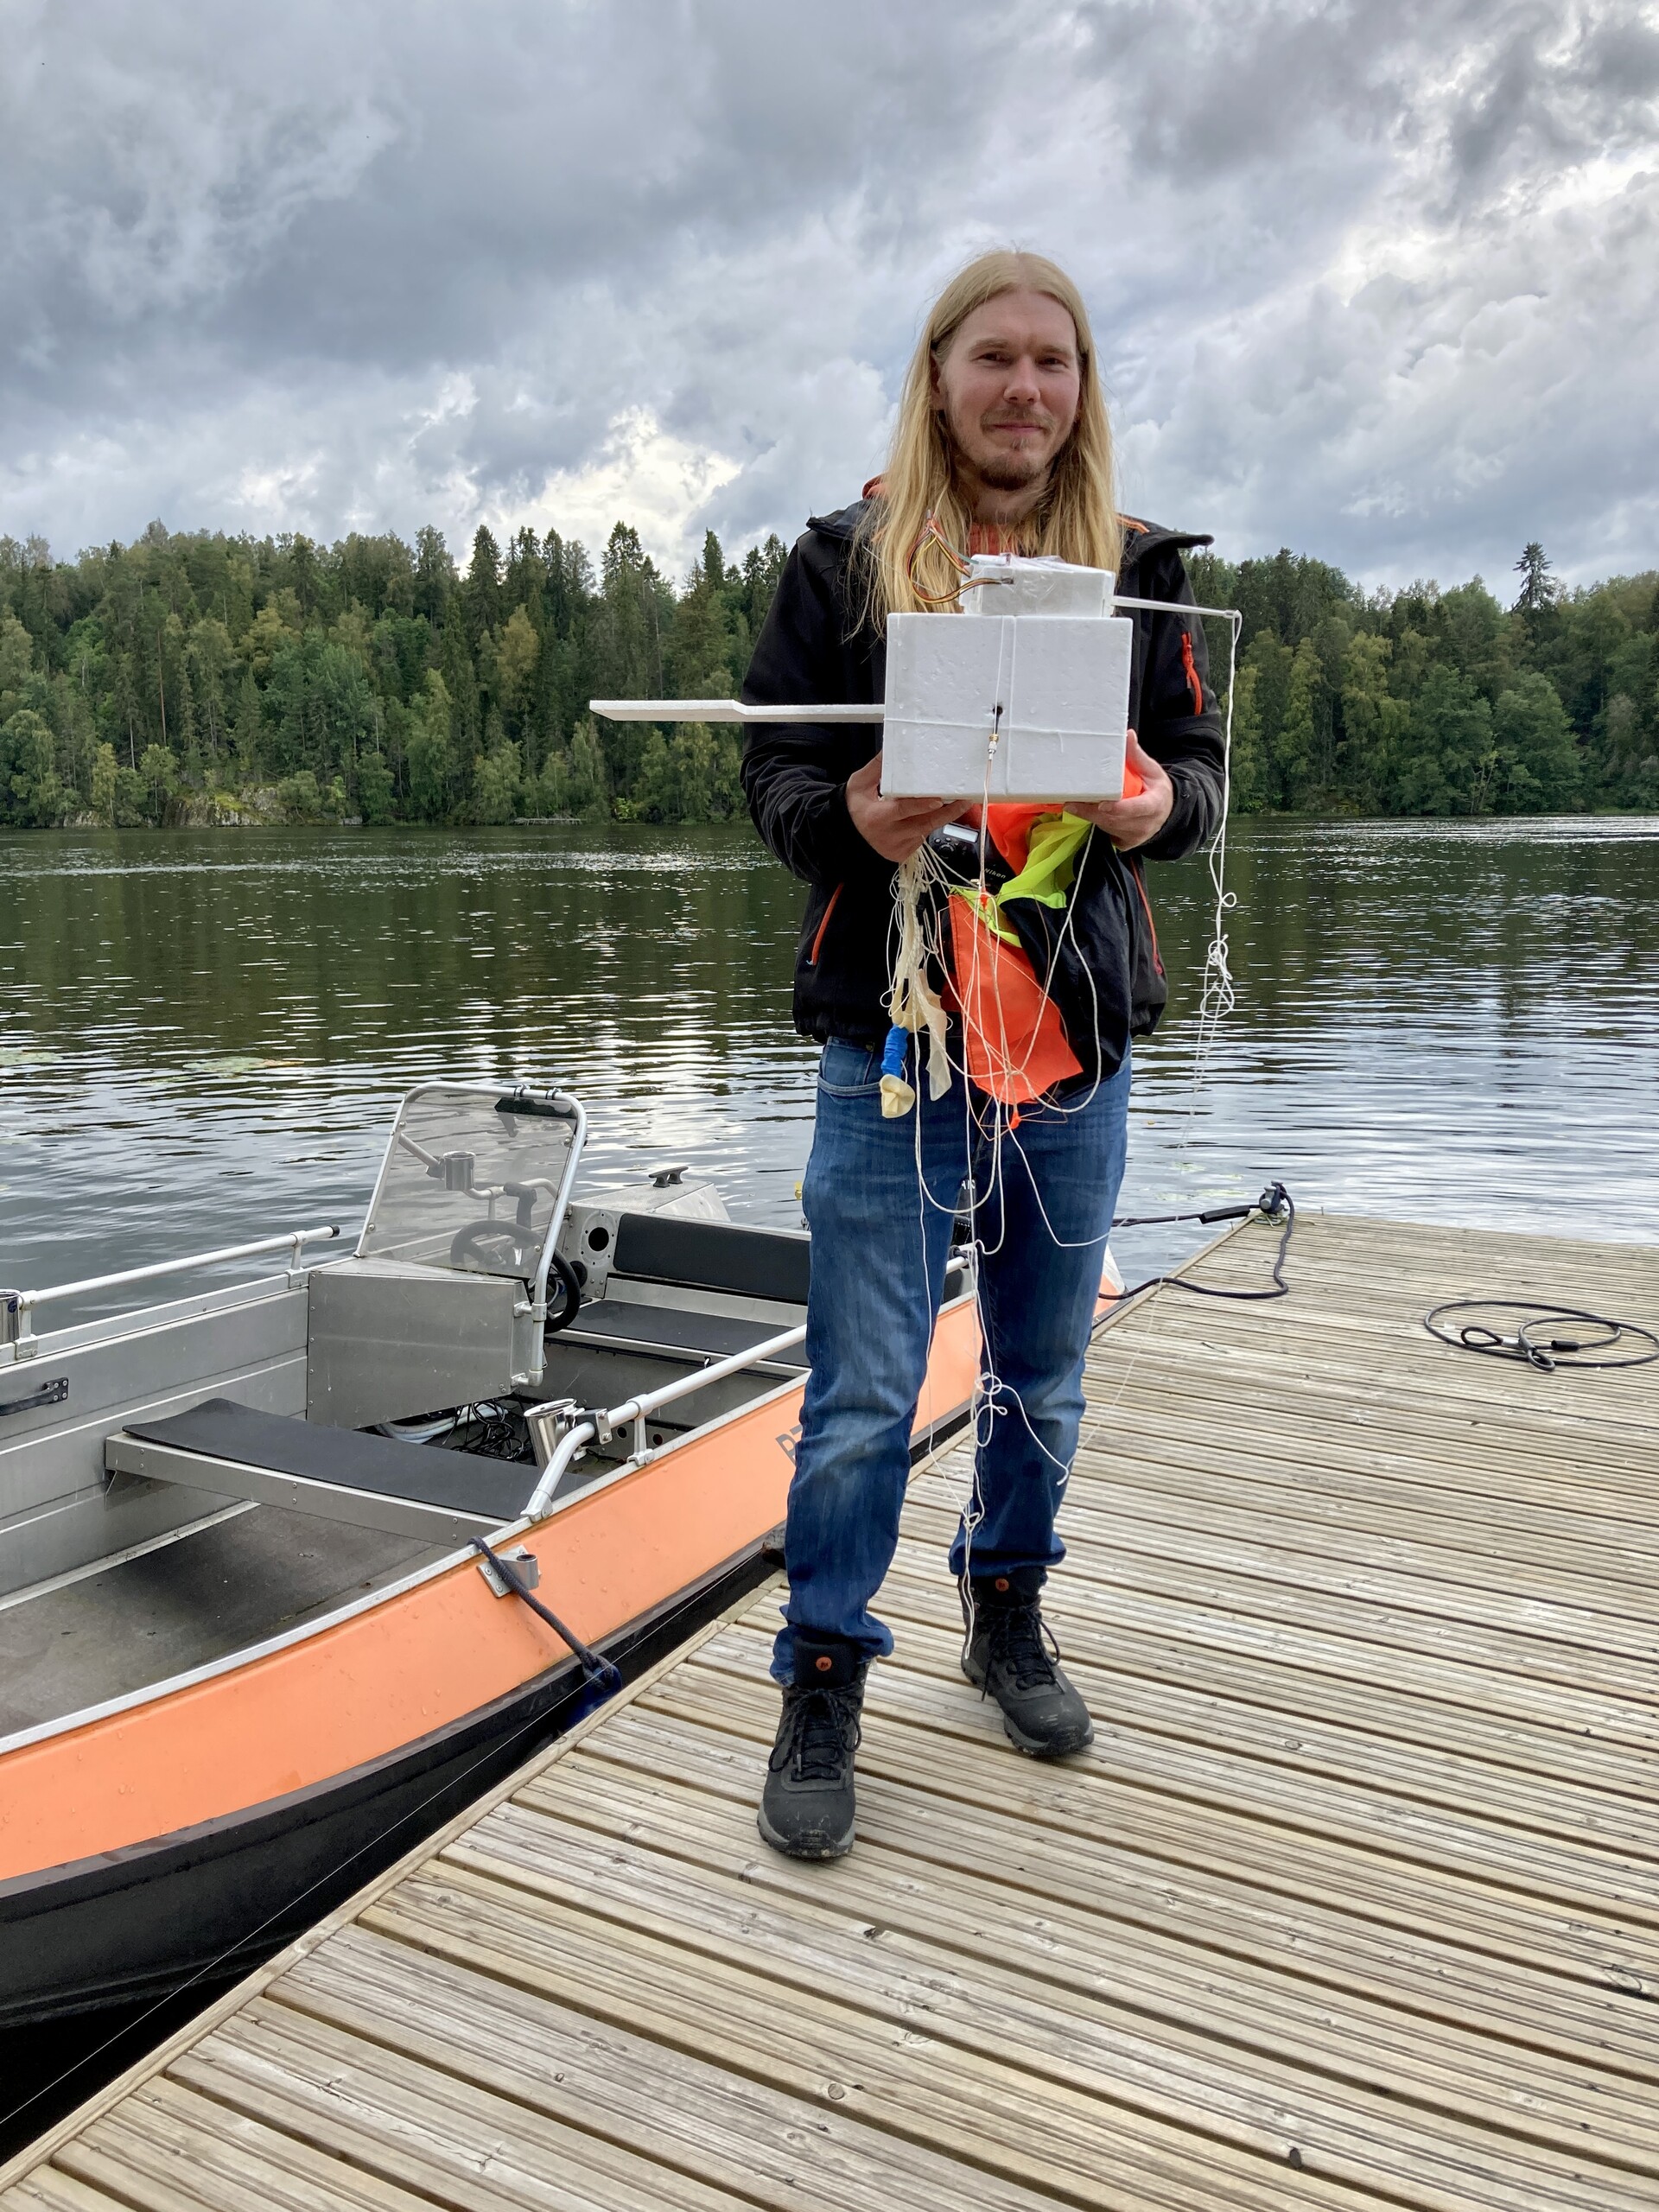
The balloon reached an altitude of 32.6 kilometers above Lempäälä and continued its descent towards Nokia. The flight payload fell into the river Nokianvirta, west of the Melo hydropower plant, contrary to the predictions and our expectations. However, the transmitters did not turn off when the payloads fell into the water, as the styrofoam enclosures caused them to float well.
Recovery of the payloads
The flight payloads were recovered from the river Nokianvirta by Mikael OH3BHX (from Hämeenlinna), Jouni OH3CUF (from Tampere), Jarmo OH3BSG (from Ylöjärvi) and Jari OH4NDU (form Lempäälä).
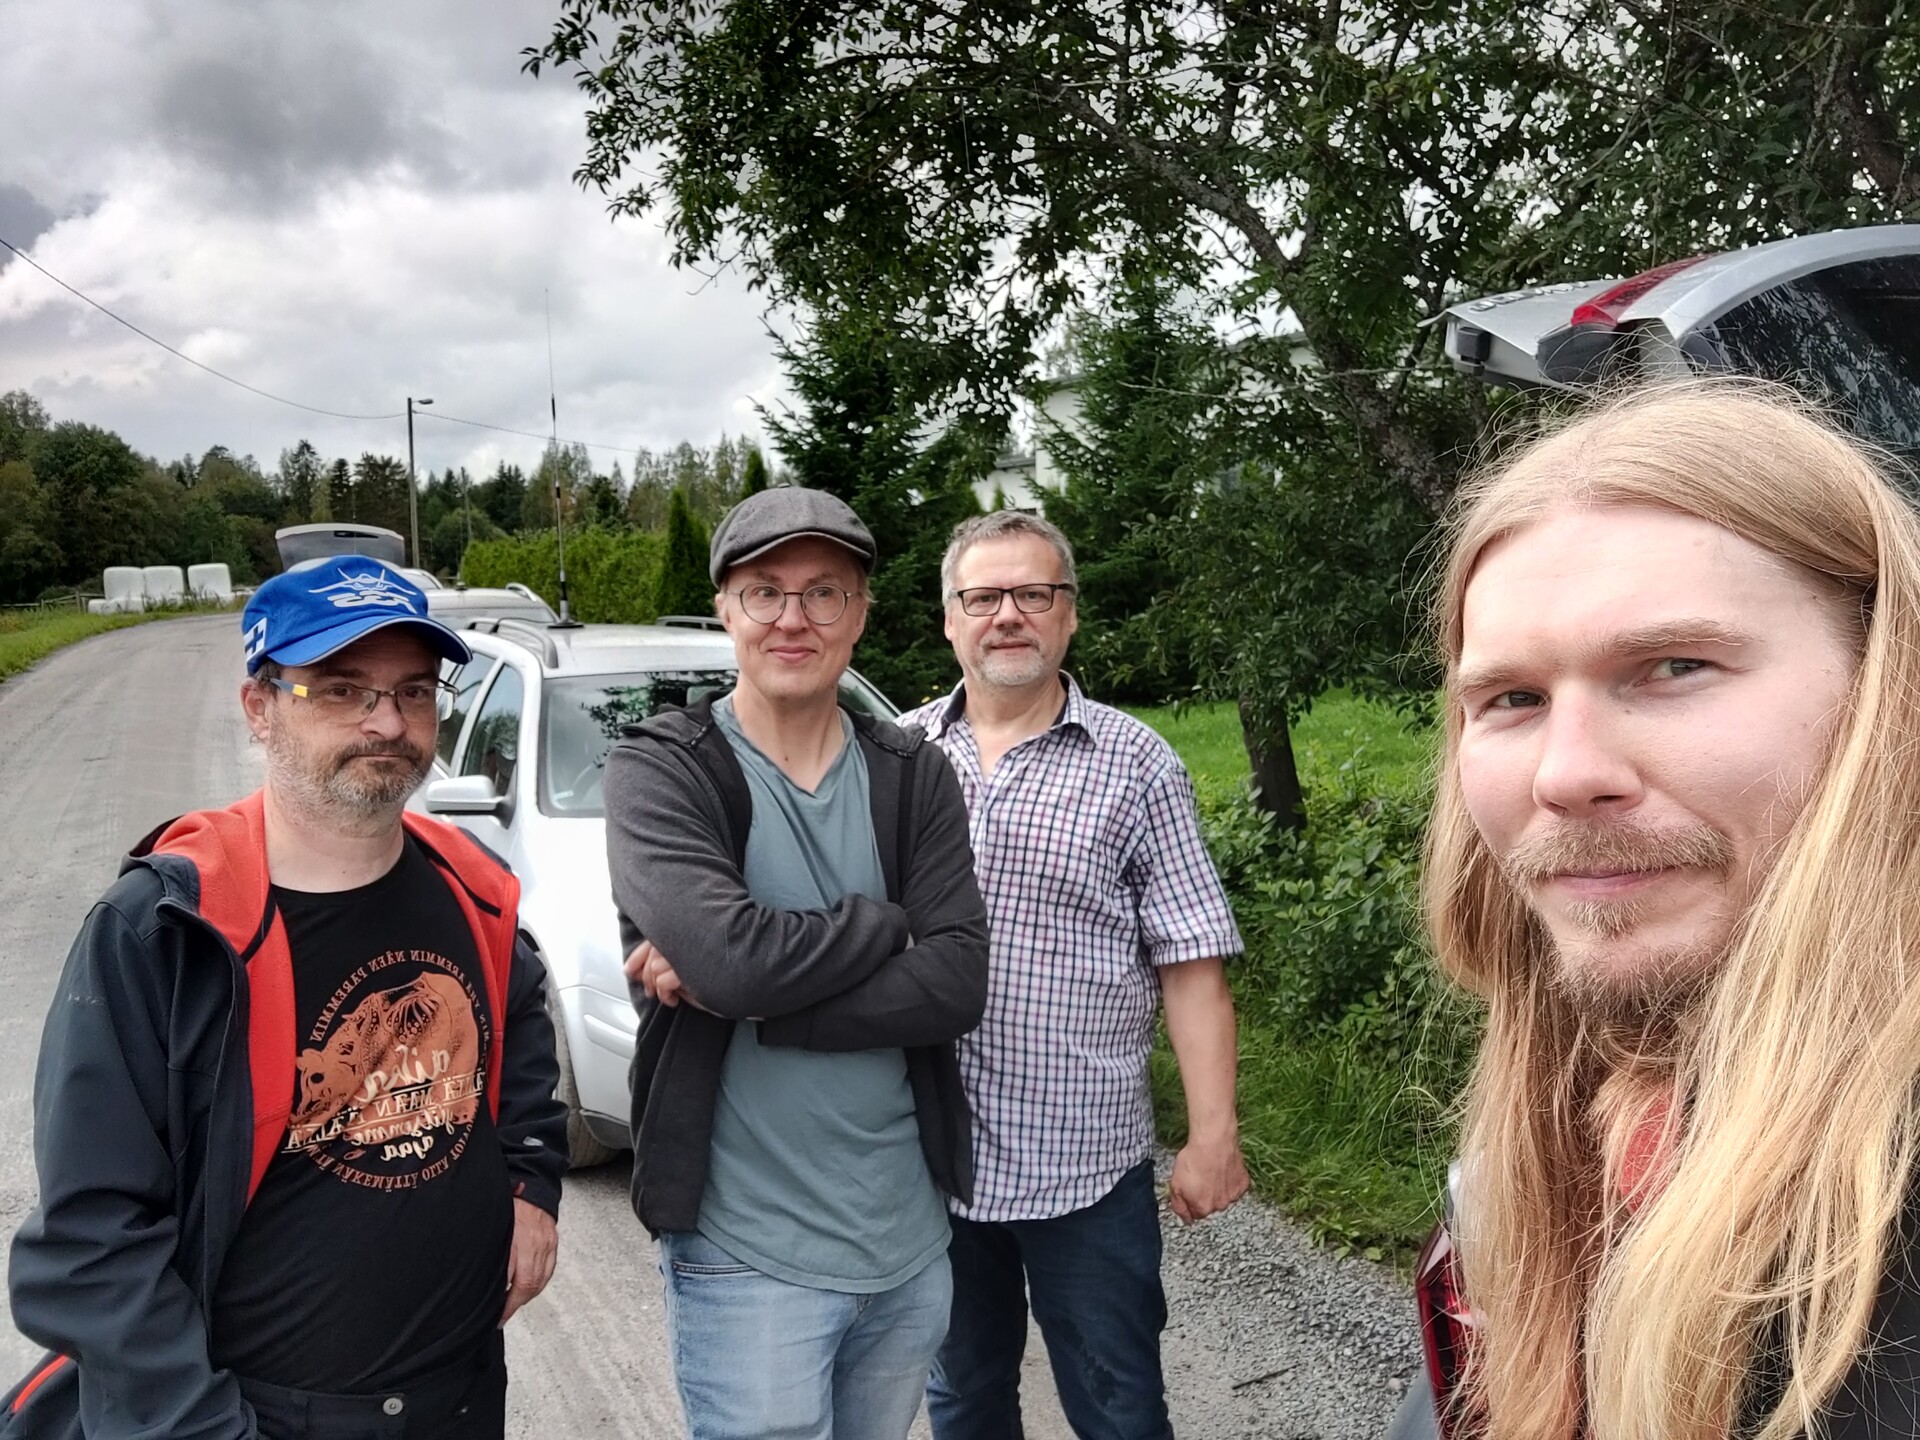
With help of the GPS position data, we ended up driving to a road near the river bank, west from the Melo hydropower plant. However, the shore was mostly steep and wooded terrain, so we walked to the nearest cottage we spotted. Near the cottage we met Tommi Lahdenperä, the resident of the house nearby, who immediately agreed to help us. We were able to look out to the river from his pier, from where we saw the balloon payloads floating a few hundred meters away.
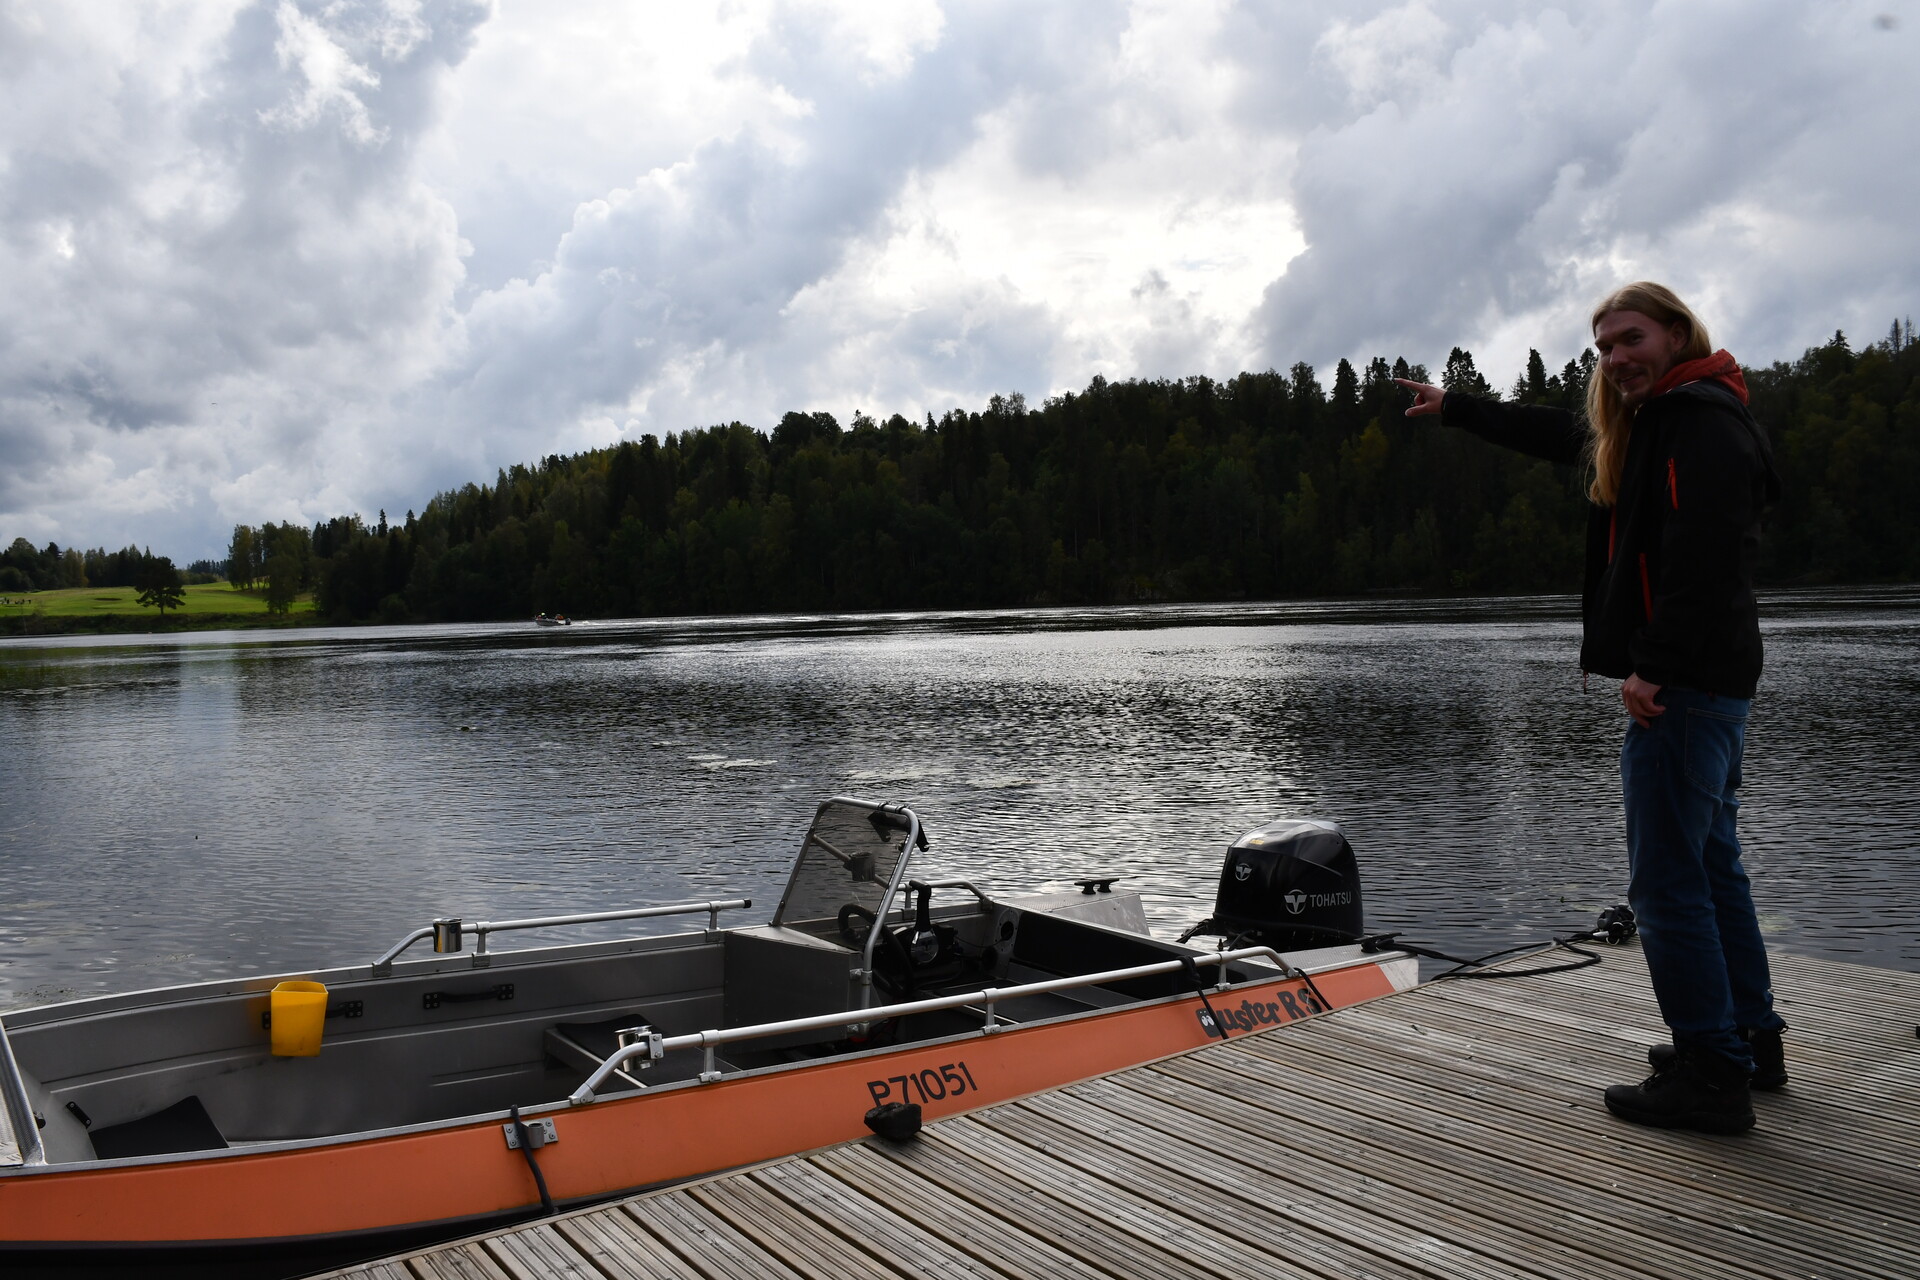
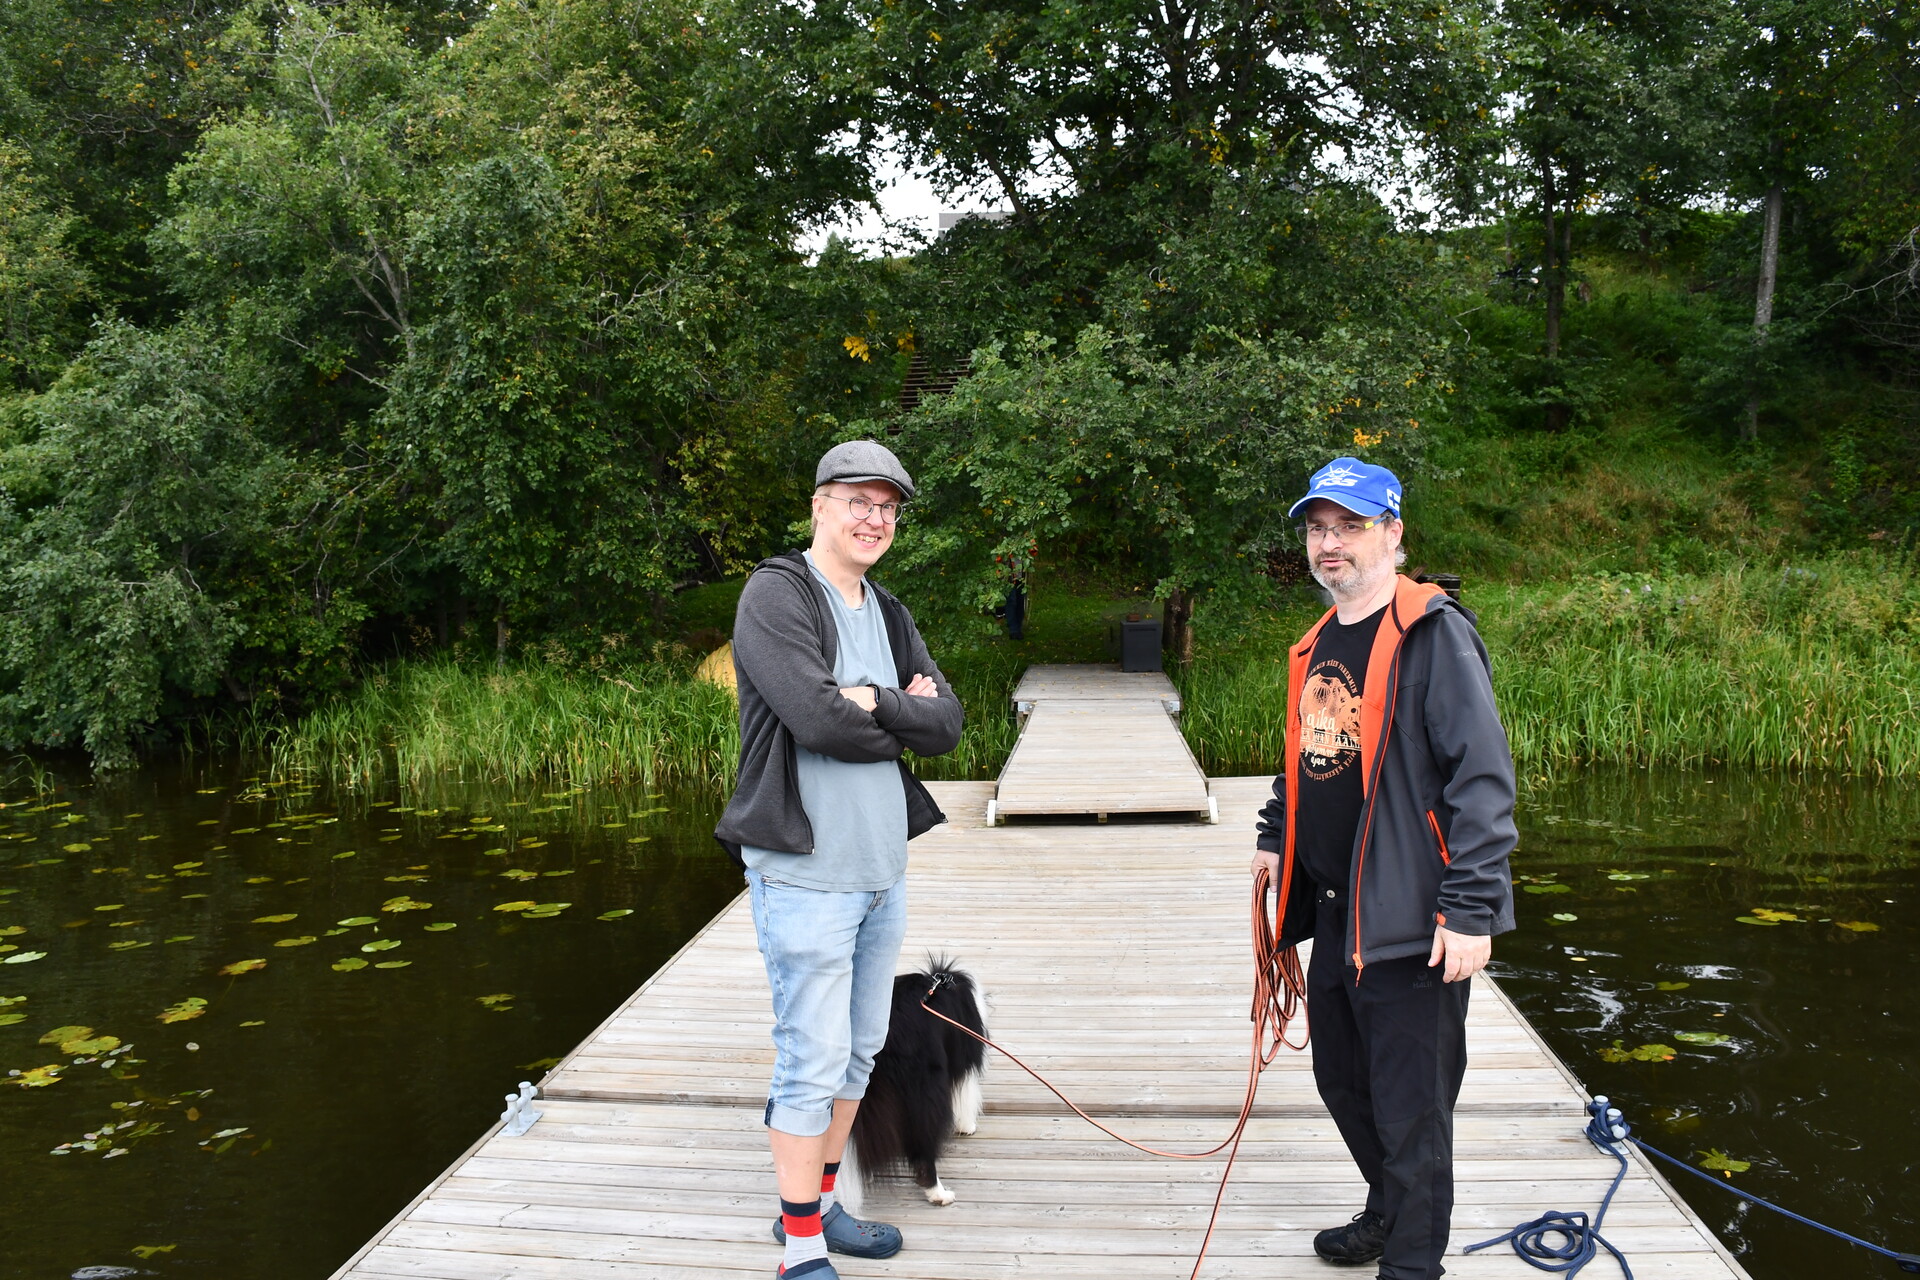
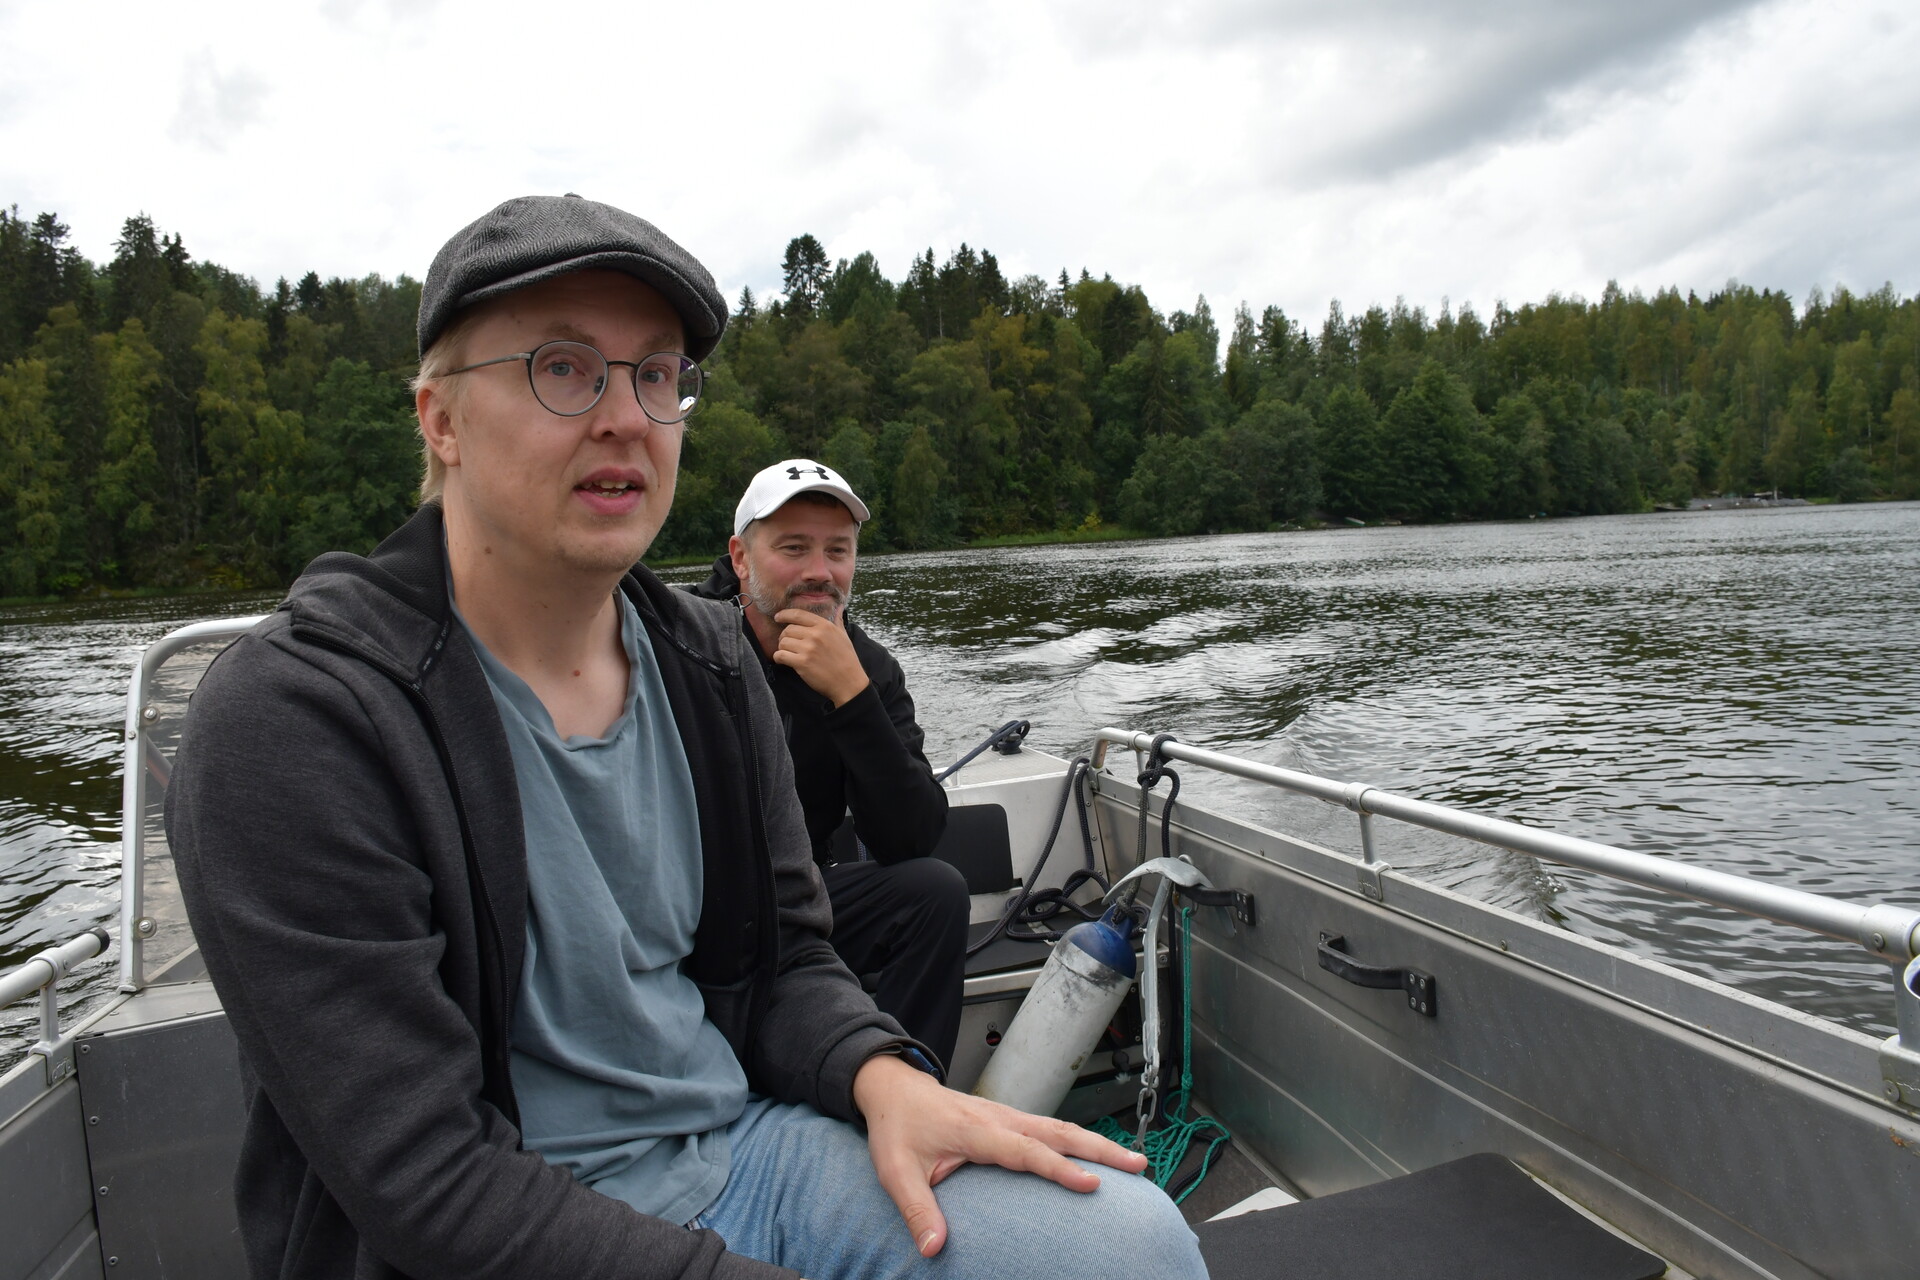
Tommi took us with his motorboat to the other side of the river where the balloon payloads were floating, and we were able to recover the devices and the parachute intact. The devices were not damaged at all, only the Raspberry Pi camera of the Wenet transmitter was slightly wet.
Amateur radio club OH3AA would like to thank everyone tracking the flight and especially those who helped in the recovery of the flight payloads!
Flight sensor data
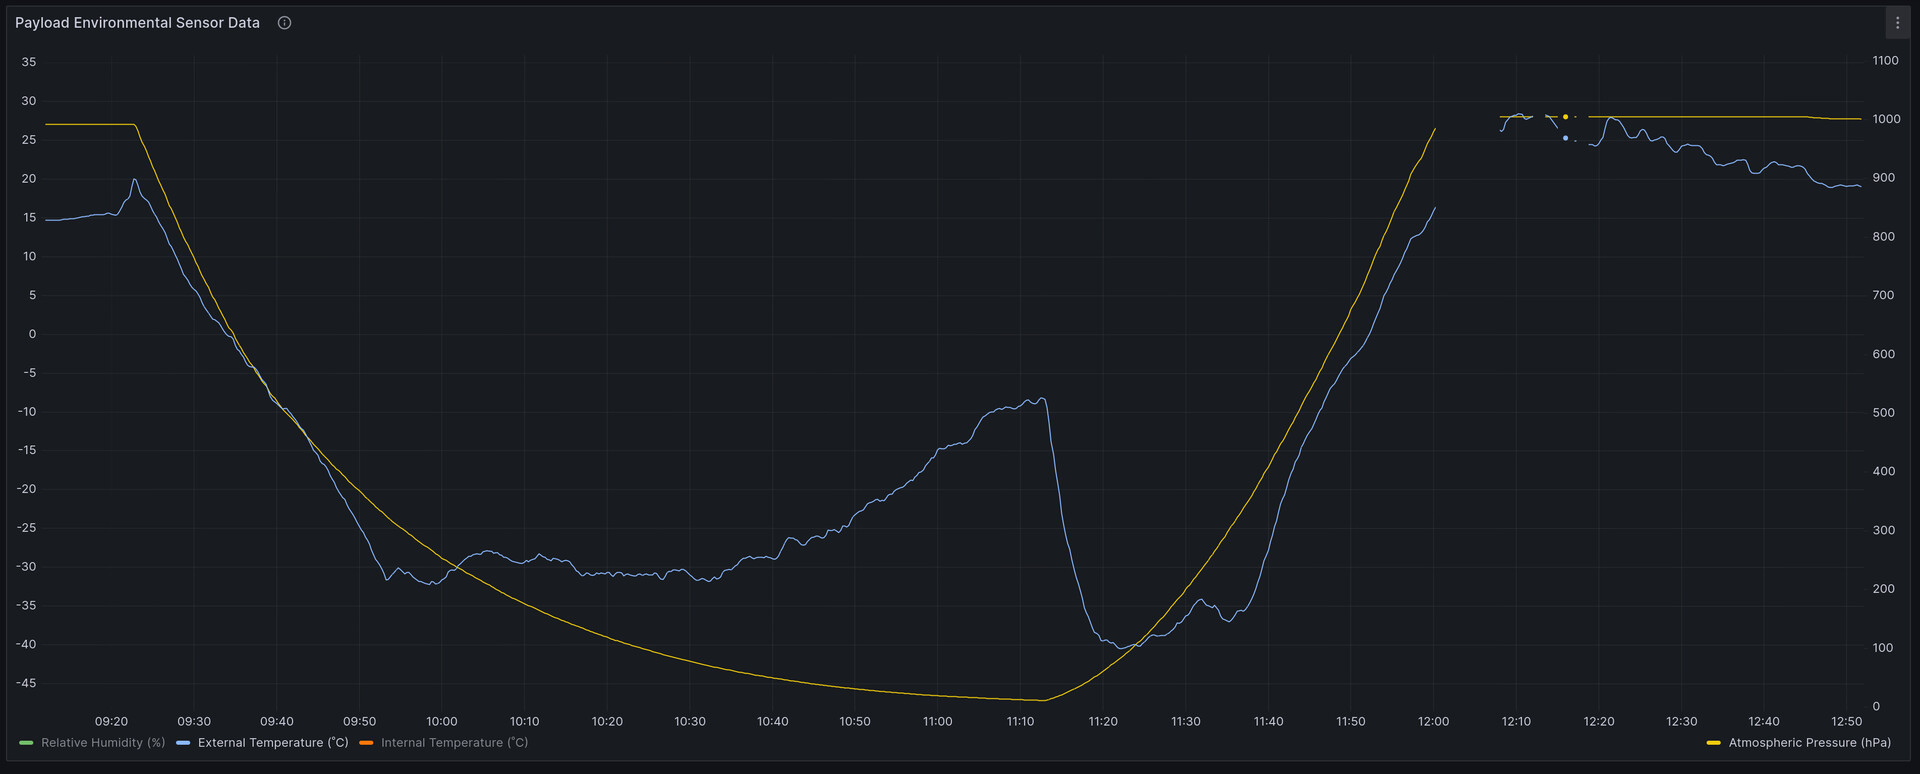
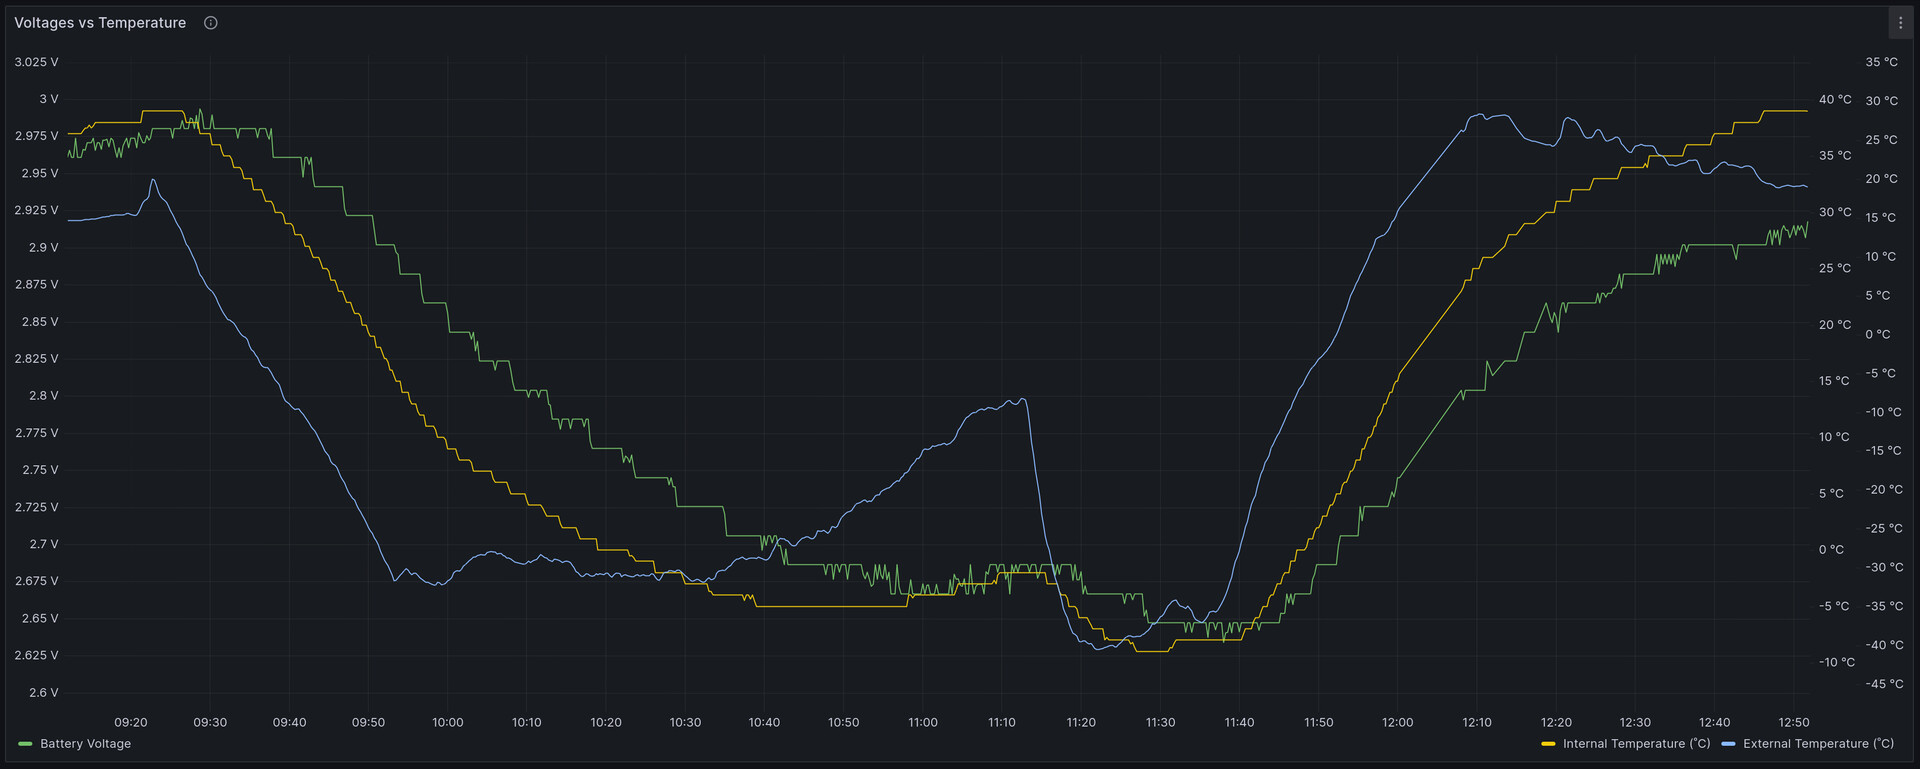
The RS41 radiosonde had two additional sensors attached: a Bosch BME280 sensor for temperature, air pressure and humidity, and a RadSens v2 radiation meter based on a Geiger tube. The radiation meter provided readings on the "micro-Roentgens per hour" (µR/h) scale.
The following graphs visualize the sensor data from the flight. The graphs are available on the SondeHub Grafana dashboard for the flight for anyone to view.
Detected radiation intensity and comparison to ground-level radiation
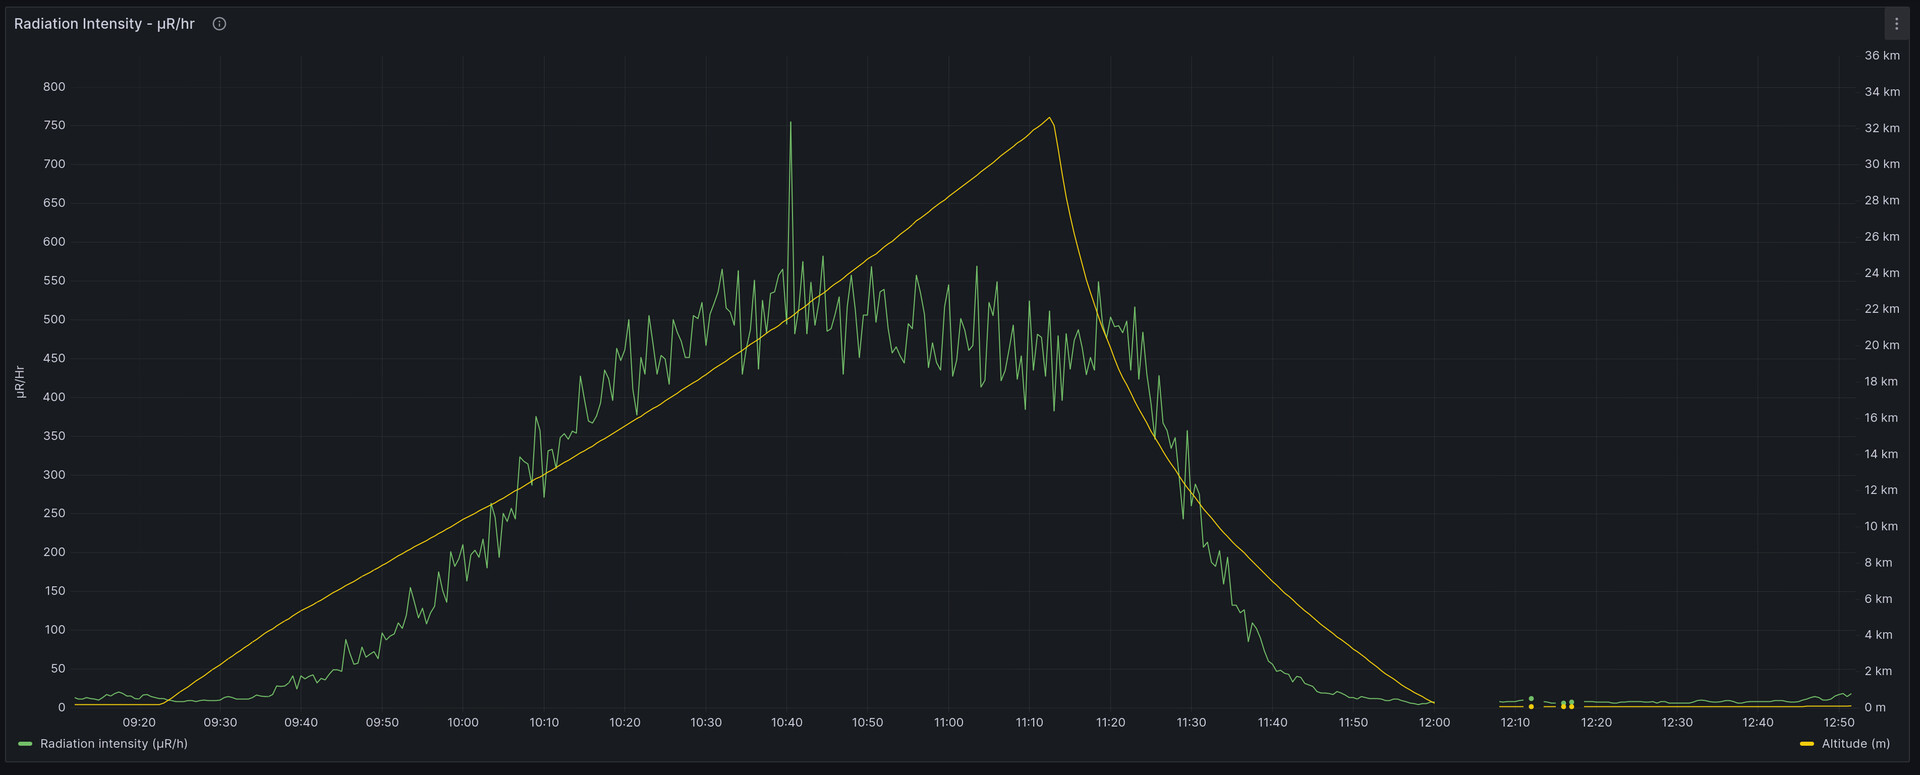
The amount of background radiation according to this Wikipedia article is about 3-6 millisieverts (mSv) per year.
When compared to the radiation intensity measured by the sensor:
-
radiation intensity at ground level was about 20 µR/h ~ 0.175 R per year, which is 1.537 millisieverts per year
-
the radiation intensity peak measured at an altitude of 20 km was 750 µR/h ~ 6.57 R per year, equalling 57.62 millisieverts per year, which is already a significantly higher dose than the average background radiation (over 10 times higher)
The measured radiation intensity relative to the altitude follows a phenomenon called the Regener-Pfotzer maximum, where the peak of ionizing radiation intensity is at about 20 kilometers above sea level. This article has more information about the radiation intensity in the atmosphere.
It is important to note that the above discussion is about annual radiation doses and that short-term (hours or days) exposure even to the highest radiation level measured (750 µR/h) is not a significant health risk for humans. For example, this table documenting the strength of ionizing radiation shows that 50 millisieverts per year is the limit for people working in the US nuclear power industry. The highest radiation level measured by the balloon would correspond to a dose of about 0.16 millisieverts per day, which is in the range of a couple of X-ray examinations.
Horus 4FSK and Wenet reception details
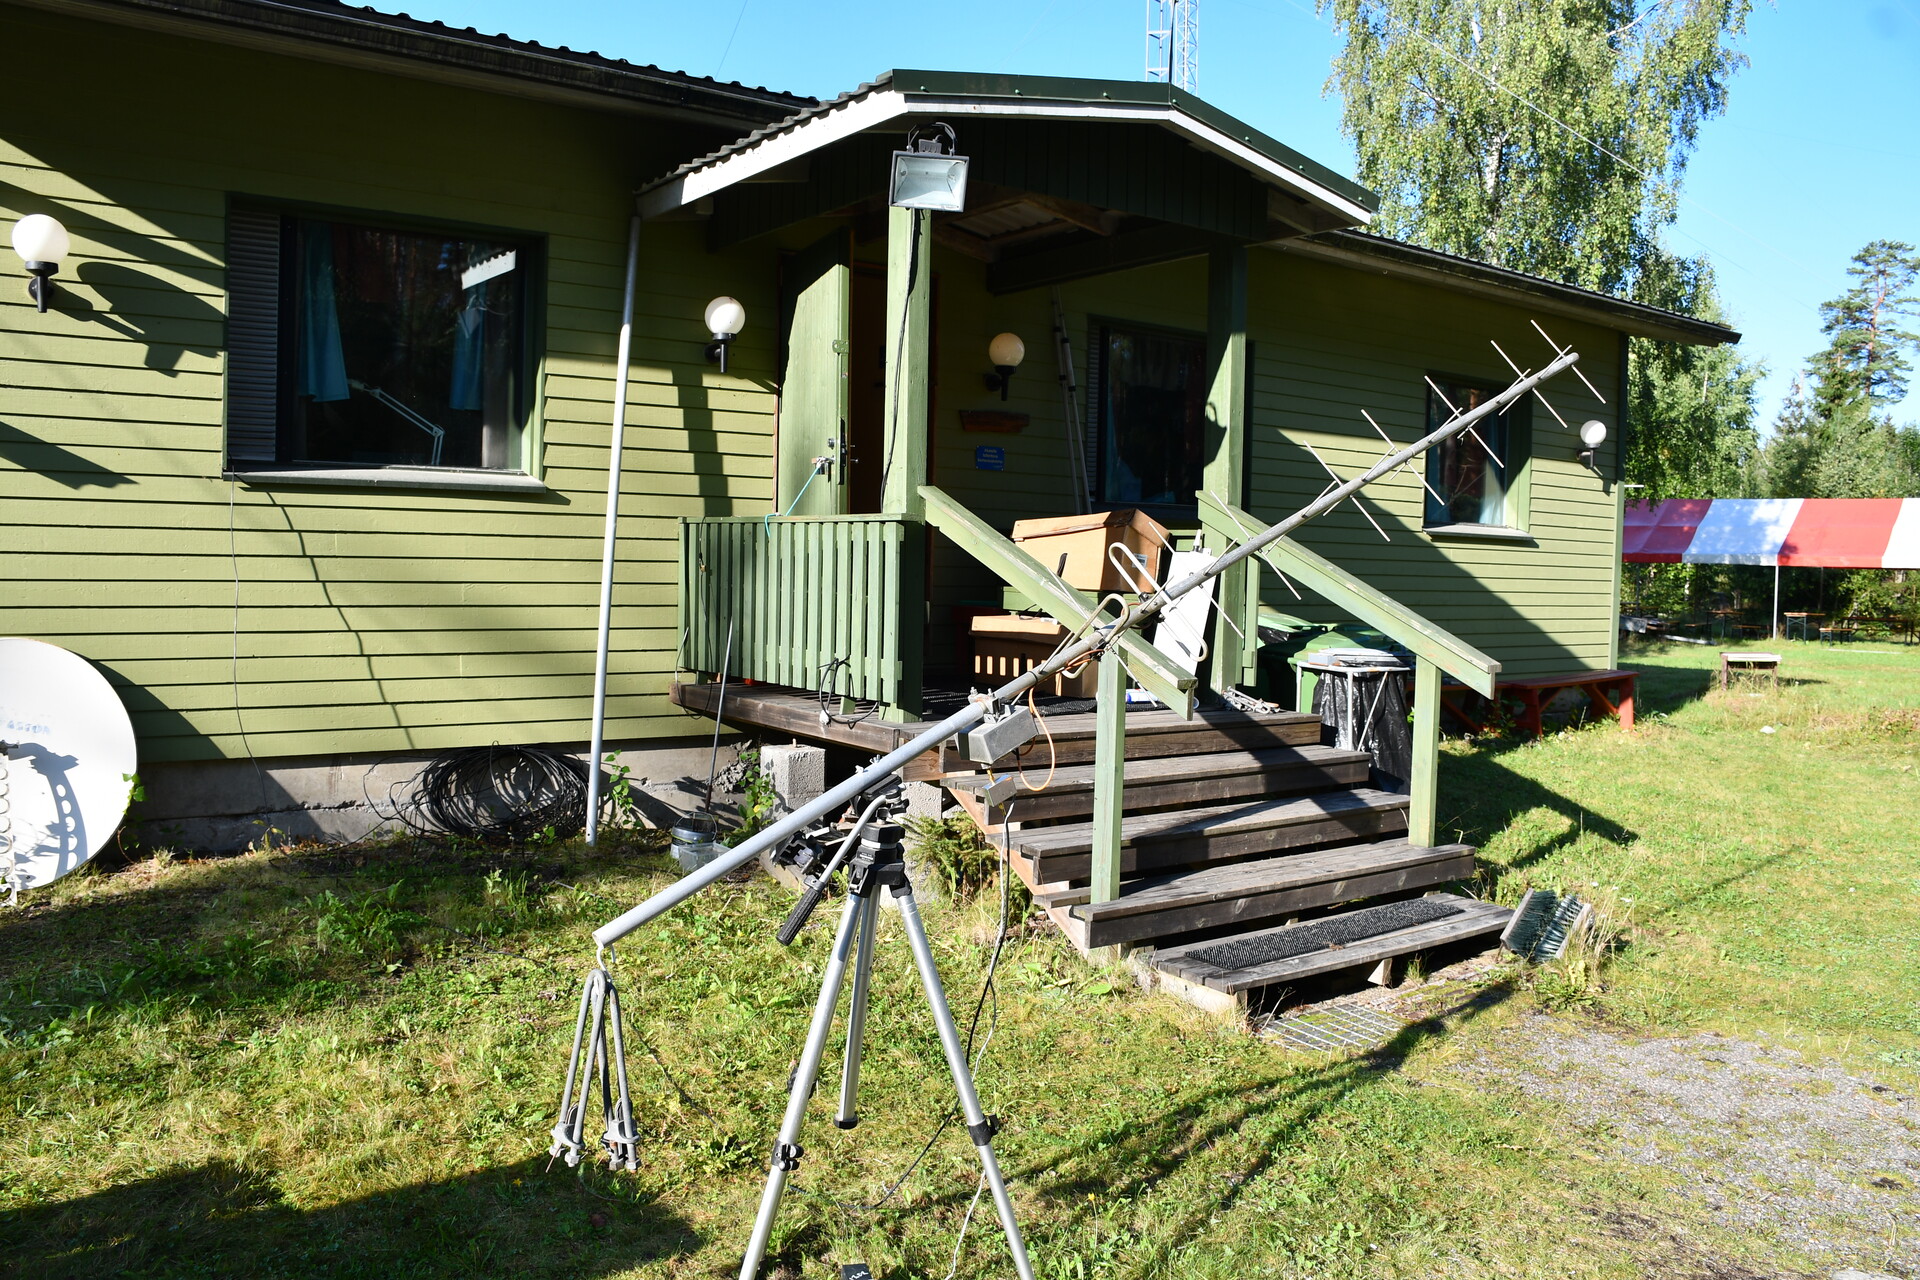
The OH3AA club receiver was a long cross-yagi antenna with a preamplifier. We used the same yagi to receive both the Horus and the Wenet transmissions. The technical specifications of the yagi were excellent for receiving Wenet images, but for some unknown reason the Wenet receiver station did not work at all. There was a problem with the receiving equipment or some possible local transmission was interfering with the Wenet reception.
Below are statistics from the stations that participated in tracking of the OH3HAB #7 flight.

Follow me on Twitter/X and Mastodon
You can also follow me on Twitter/X at @mikaelnou and on Mastodon mikaelnou@mastodon.online where I will publish content about radiosondes, high-altitude balloons and amateur radio in general!